

Hire the Best Infographics Designers
Work with the world's best infographics designers. Explore our curated marketplace of top-rated freelance talent trusted by global brands.
Find your Infographics Designer on Dribbble




































Discover more Freelance Infographics Designers on Dribbble



 Art by Karen Novelo
The Dribbble Standard
Dribbble is the creative marketplace where businesses discover, hire, and pay leading designers and agencies with community-validated portfolios since 2009. Clients, from startup founders to global brands, trust our human-first ecosystem for finding designers.
What sets Dribbble apart:
- Strong community of design experts ready for hire
- Verified experience and skill sets
- Direct access to infographic designers and agencies
Top Infographics Design profiles showcase real work, giving you confidence in both craft and capability.
The Definitive Guide To Hiring Infographics Designers
What Does an Infographics Designer Do?
An infographic designer turns research, data, and complex information into a visual story that is easier to understand. The work includes identifying the most important findings, choosing the right visual format, and arranging information in a clear reading order.
Depending on the project, designers may create charts, diagrams, timelines, comparisons, maps, or illustrated data points. They also make sure labels, scales, units, and source information are presented clearly so the graphic communicates the data accurately.
Deliverables can include long-form web infographics, social graphics, print versions, and slide-sized adaptations. Strong designers also provide editable source files so figures, text, or translations can be updated later.
Why Hire an Infographics Designer?
An infographic designer helps turn complex information into a visual format that is easier to understand, compare, and share.
Infographic designers can help:
- Reduce a large dataset to the few findings that carry the argument
- Choose chart types that match the shape of the data
- Keep axes, scales, and units honest, so the graphic survives scrutiny
- Set a reading order that carries the eye from headline finding to supporting detail
- Design long-form vertical layouts and single-stat social graphics from one dataset
- Place the source, sample size, and collection date on the graphic itself
- Check colour contrast and keep categories distinguishable without relying on hue
- Export web, print, and platform-sized versions from one master file
- Deliver editable source files with live text ready for correction or translation
How to Hire an Infographics Designer
Step 1: Define the argument and the data behind it
Write the one sentence you want a reader to take away, then confirm you have the underlying data in a usable form: a spreadsheet with clean headers rather than figures scattered through a report. Note the sample size, the collection date, and the source line that must appear on the finished graphic.
Pro tip: Decide before briefing whether any finding is off-limits or legally sensitive. Compliance and legal review is faster to run on a data outline than on a finished illustrated layout.
Step 2: Review Infographics Designer portfolios
Judge the charts, not the illustration. Look for work where real numbers are plotted and check whether the axes, scales, and labels are defensible, since a decorative infographic with no verifiable data behind it proves very little.
Pro tip: Read the small type in portfolio pieces. Designers who habitually include source lines, sample sizes, and units are the ones who have worked with researchers and communications teams that review claims.
Step 3: Evaluate their process
Ask how they work from a raw dataset, whether they will push back if a chart type misrepresents the numbers, how they handle values that do not sum cleanly, whether they run contrast and colour vision checks, and what happens to the layout when a figure is corrected late.
Pro tip: Ask how they would handle a chart where the most visually dramatic option could exaggerate the difference in the data. The answer shows whether they treat accuracy as part of the design.
Step 4: Align on the scope and timeline
Confirm the number of graphics and the format variants of each, who owns data accuracy and fact-checking, the number of revision rounds, whether the editable source file transfers to you with live text, which export formats and resolutions you receive, and how a later data refresh or a translated version would be priced.
Pro tip: Ask for the source file with fonts either packaged or licensed to you. A locked or outlined file means every future number change comes back to the designer as a paid job.
Cost of Hiring an Infographics Designer
Freelance infographic designers typically charge $40 to $150 per hour, depending on experience, specialization, and project complexity.
Highly sought-after specialists may charge up to $300 per hour. A separate 2025 pricing guide places typical freelance infographic rates at $50 to $150+ per hour, supporting the same general market range.
Hourly rates by experience generally fall into these ranges:
- Less experienced freelancers: $40–$60 per hour
- Established freelancers: $65–$150 per hour
- Highly sought-after specialists: up to $300 per hour
Final pricing depends on how much analysis is required before the design begins, the number and complexity of charts, the length of the infographic, whether custom illustration is needed, and how many versions are required for web, print, social media, or presentations. Animation, interactivity, translation, and additional review rounds can also increase the cost.
Freelance Infographics Designer vs Design Agency
The main difference is scope: a freelance infographics designer focuses on a defined visual communication project, while a design agency can support broader research, content, brand, and campaign work.
| Factor | Freelance Infographics Designer | Design Agency |
|---|---|---|
| Best for | A specific dataset, report, or campaign graphic | An ongoing research or content programme with recurring publication |
| Typical scope | Data reduction, chart design, layout, and export sets | Research planning, editorial strategy, design system, and distribution |
| Communication | Direct access to the designer | Communication with a multidisciplinary team |
| Flexibility | Often more flexible | More structured process |
| Team | Usually one specialist | Multiple creative specialists |
| Choose when | The numbers exist and need to be made legible | You are building a repeatable data storytelling function |
Featured Infographics Designer Success Story
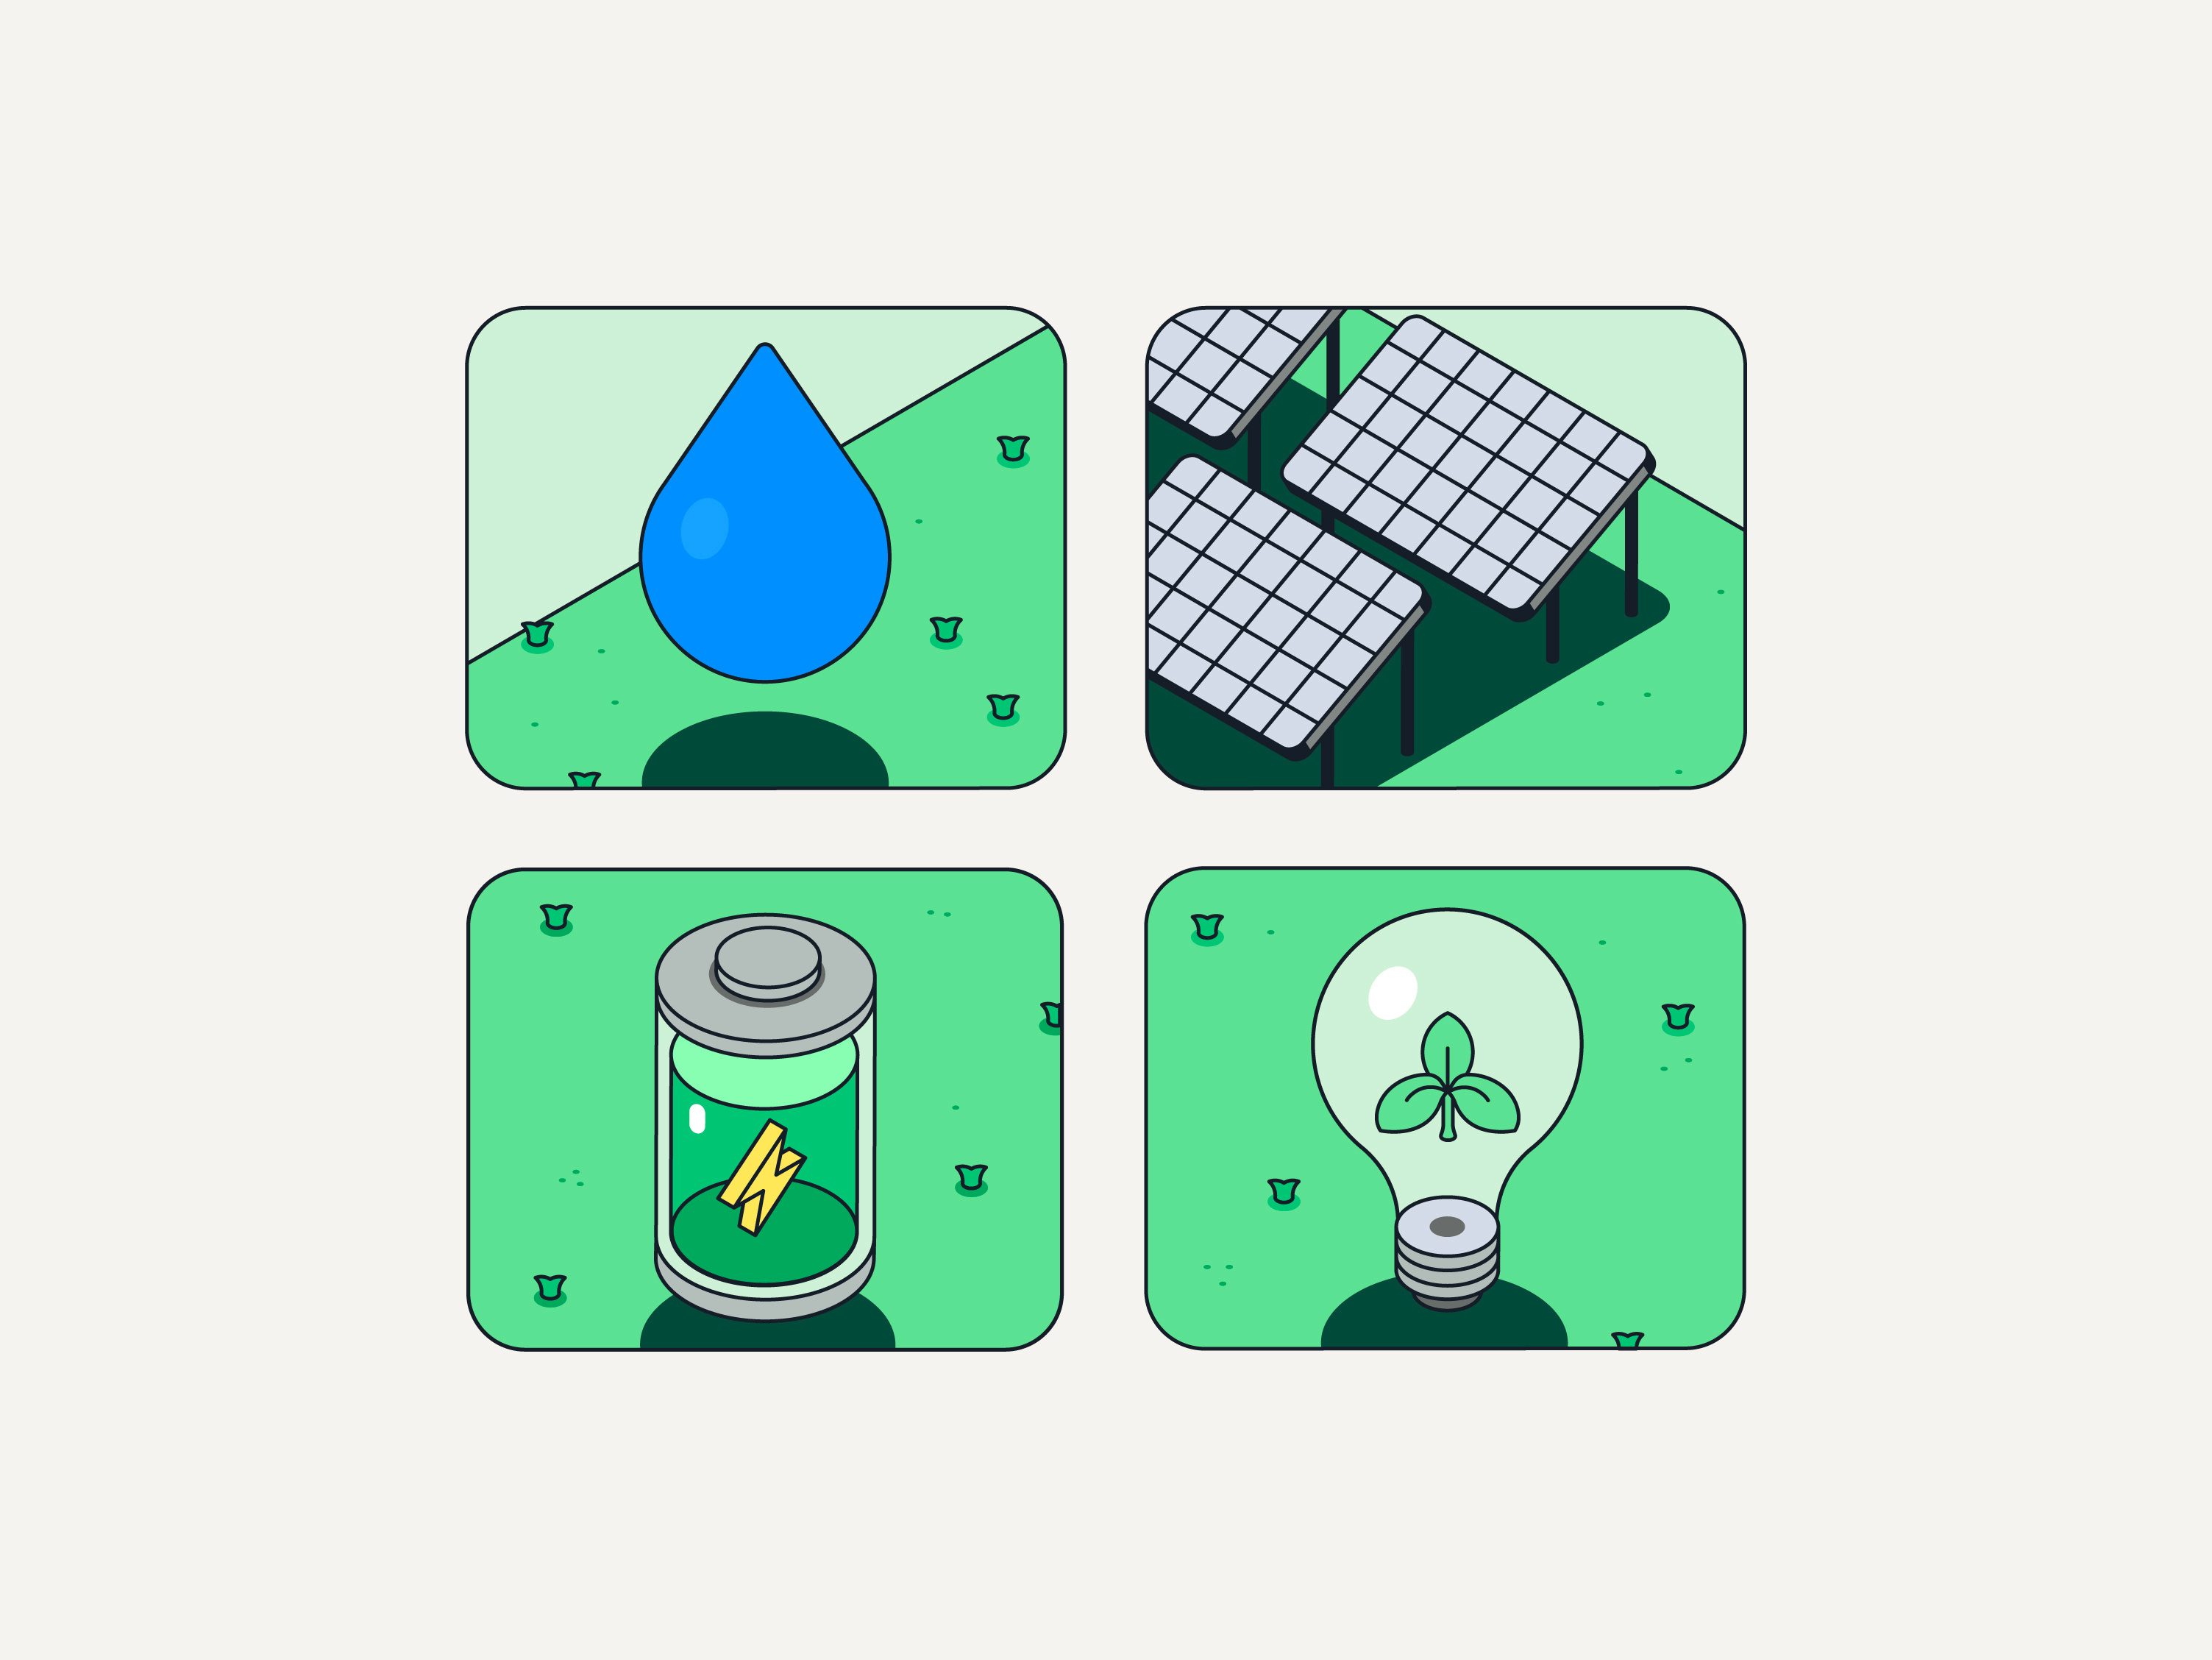
Dribbble gives infographic designers a platform to show how complex information can be organized into clear visual systems. This featured project demonstrates how illustration and information hierarchy can explain sustainability features across a large physical site.
Explore: Isometric Infographic for Delivery Station by Marina Kozlova
- Challenge: Explain the sustainable materials and initiatives used across a new delivery station and its surrounding site in one clear visual.
- Solution: Marina Kozlova created a fully vector isometric infographic combining an overall site view with detailed pullout illustrations highlighting individual materials and sustainability features.
- Result: The final infographic was adapted for both a 12 × 7 ft banner and a 24 × 36 in poster, creating a consistent visual system across two large-format applications.
Related Infographics Design Resources
How To Hire A Professional Infographics Designer on Dribbble
Use InstantMatch to connect with the right designer fast.
-
Step 1
Submit your Project Brief
-
Step 2
Get Matched with Vetted designers
-
Step 3
Start your project
Frequently Asked Questions on Hiring Infographics Designers
Yes. Many infographic designers can work from spreadsheets, survey results, reports, articles, or other source material and turn it into a clear visual story. For data-heavy projects, look for someone who can identify the most important information rather than simply placing every number into the design.
A strong designer chooses charts and visual formats that represent the numbers clearly without exaggerating or distorting them. They should also check labels, scales, units, sources, and relationships between data points. You should still provide verified source data and approve the final information before publication.
Some can. Static infographics are typically delivered as image, PDF, or vector files, while animated and interactive projects require additional motion or development skills. Check the designer’s portfolio for the specific format you need rather than assuming every infographic designer works across all three.
The right formats depend on where the infographic will be used. You may need PNG or JPG files for the web, PDF or vector files for print, and editable source files such as AI or SVG for future updates. If the data is likely to change, confirm that editable files are included.
Browse Infographics Designer profiles on Dribbble or use InstantMatch to quickly connect with vetted infographics designers who fit your dataset, output formats, and timeline.
Have another question? Check out the Dribbble Help Center for more answers.


