Dribbble: the community for graphic design
Shots
Shots
Designers
Services
Explore
Popular
New and Noteworthy
Product Design
Web Design
Animation
Branding
Illustration
Mobile
Typography
Print
Find Talent
Browse Profiles
Purchase Services
Talk to Talent Expert
Post a Full-Time Job
Get Hired
Upgrade to
Pro
Advertise
Full-Time Jobs
Blog
Sign up
Log in
Tiziana Alocci
London, United Kingdom
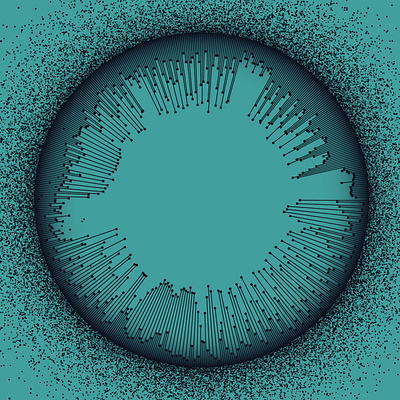
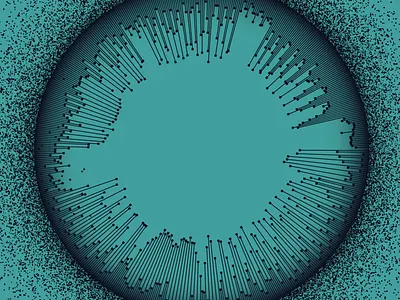
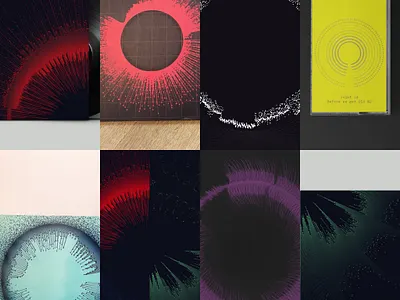
Illustration, UI / Visual Design, Product Design
Get in touch
Follow
Following
Blocked
Work
Collections
Liked Shots
About
Recent Shots
Recent Shots
Popular Shots
View RA, data-driven album cover
RA, data-driven album cover
Like
View Trial and Error, data-driven album cover
Trial and Error, data-driven album cover
Like
View Flageolet, data-driven album cover
Flageolet, data-driven album cover
Like
View A degree of concern
A degree of concern
Like
View Data-driven album cover
Data-driven album cover
Like
View Data-driven album cover - Terra Incognita
Data-driven album cover - Terra Incognita
Like
View Data-driven album cover
Data-driven album cover
Like
View 📰Celebrating 50 years of publishing house Sellerio 📰
📰Celebrating 50 years of publishing house Sellerio 📰
Like
View 🎤 Working on a new workshop! 🎤
🎤 Working on a new workshop! 🎤
Like
View 🧪The Periodic table of... 🧪
🧪The Periodic table of... 🧪
Like
View 🔬The Periodic table of discoveries... 🔬
🔬The Periodic table of discoveries... 🔬
Like
View 🏷 What's your favourite way to label charts? 🏷
🏷 What's your favourite way to label charts? 🏷
Like
View ⏳Visualising time - Work in progress⏳
⏳Visualising time - Work in progress⏳
Like
View 🔵Circles, dots and bubbles 🔵
🔵Circles, dots and bubbles 🔵
Like
View 🔵How to... bump chart 🔵
🔵How to... bump chart 🔵
Like
View 🔭How to... horizon graph 🔭
🔭How to... horizon graph 🔭
Like
View 🔵How to... 🔵
🔵How to... 🔵
Like
View 👩⚖️🏛Top and landmark lawsuits infographic 🏛👨⚖️
👩⚖️🏛Top and landmark lawsuits infographic 🏛👨⚖️
Like
View 💘Stuck with this Sailor Moon's colour palette 💘
💘Stuck with this Sailor Moon's colour palette 💘
Like
View 🔍Exploring new visual models 🔍
🔍Exploring new visual models 🔍
Like
View 🌍Mapping data about Earth's temperature 🌍
🌍Mapping data about Earth's temperature 🌍
Like
View A data story in stop-motion
A data story in stop-motion
Like
View Infographic report - detail
Infographic report - detail
Like
View Dataviz magazine issue 2
Dataviz magazine issue 2
Like
← Prev
Next →
Sign up to continue
Loading more…
Available for new projects
Get in touch
Previous
Next
Loading…