

About this Service
About this Service
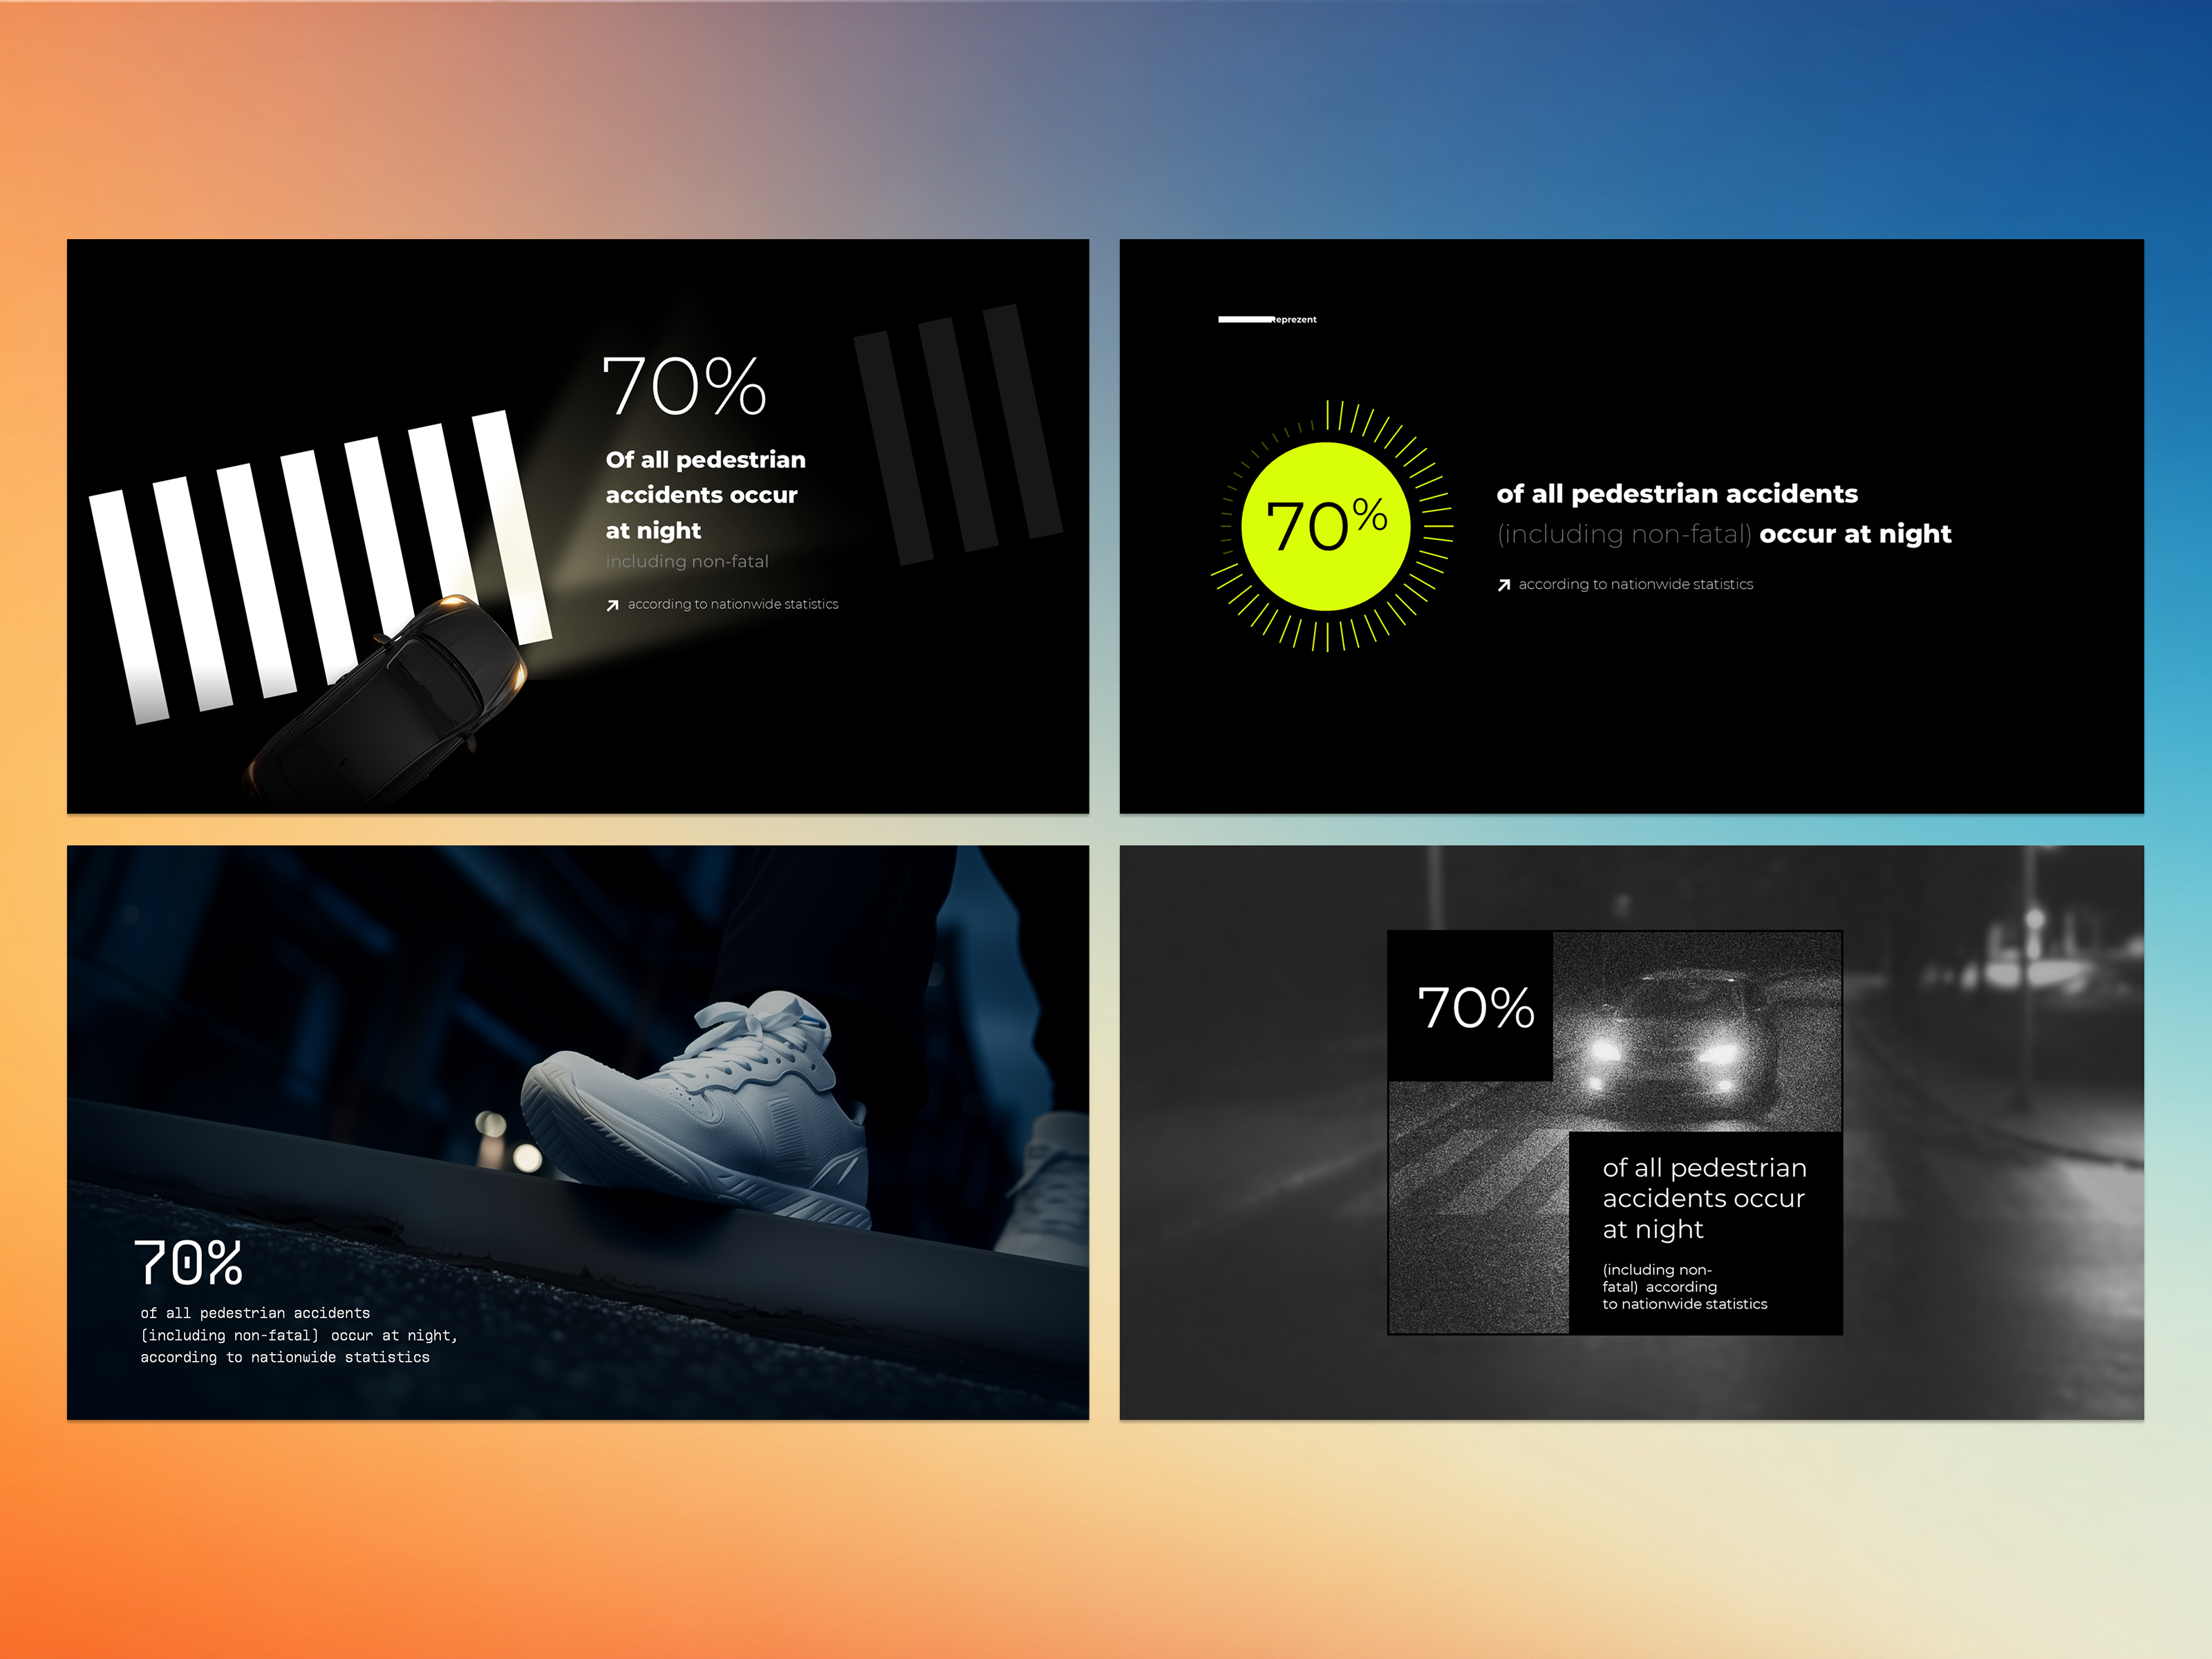
Numbers don't lie — but without the right visual, they don't speak either. Our Data Visualization service transforms raw data, complex metrics, and dense reports into clean, compelling visuals that audiences actually understand. Whether it's a single powerful infographic or a full set of charts for your pitch deck or annual report — we make your data impossible to ignore.
Who We Are
Reprezent is a dedicated presentation design studio with 10+ years on the market, 3,000+ projects delivered, and 800+ clients worldwide — from ambitious startups with bold visions to global brands like PepsiCo, Salesforce, and 3M. We know how decision-makers read data — and we design for that.
What You Get
📊 Custom charts and graphs — bar, line, pie, funnel, scatter, and beyond
🧩 Tailor-made infographics with the right visual hierarchy and accents
🎨 On-brand design — colors, fonts, and style aligned to your identity
✏️ Clear data storytelling — no clutter, no confusion, just clarity
📁 Editable source files (PowerPoint, Keynote, Figma, Canva or Google Slides)
📑 Export-ready formats — PDF, PNG, SVG upon request
Pricing
📦 5 slides / visuals — $600
📦 10 slides / visuals — $1,200
📦 15 slides / visuals — $1,700
📦 Need more? Contact us for a custom quote
Our Process
Data Review — you share your data, context, and goals
Structure & Logic — we define the right chart types and visual flow
Design Draft — first version with style and layout for your approval
Refinement — up to 3 revision rounds until it's pixel-perfect
Delivery — editable files + export-ready formats
Optional Add-Ons
🔍 Data audit and storytelling recommendations
📐 Full deck integration — visuals adapted into your existing presentation
⚡ Express turnaround (48–72 hours)
🌐 Multi-language versions
Perfect For
Startups • Founders • Marketing & Sales Teams • Analysts • Consultants • Annual Reports • Pitch Decks • Investor Updates • Conference Presentations
Why Choose Us
Because data visualization isn't just about making charts look pretty — it's about making complex information land instantly. With 10+ years and thousands of projects behind us, we know what makes decision-makers stop, read, and remember. We don't just visualize your data — we give it a voice.