Dribbble: the community for graphic design
Shots
Shots
Designers
Services
Explore
Popular
New and Noteworthy
Product Design
Web Design
Animation
Branding
Illustration
Mobile
Typography
Print
Hire a Designer
Browse Freelancers
Purchase Services
Submit a Project Brief
Post a Full-Time Job
Find Jobs
Blog
Sign up
Log in
report
Browse report designs for inspiration
Related:
annual
data visualization
analysis
graph
booklet
chart
Popular
Popular
New & Noteworthy
Discover
Animation
Branding
Illustration
Mobile
Print
Product Design
Typography
Web Design
Filters
Clear
Tags
Clear
Color
#faddd1
#fad3d1
#fad1e6
#e5d1fa
#d4d1fa
#d1e3fa
#d1f3fa
#d1faf0
#d1fad7
#ebfad1
#faf9d1
#faefd1
#fae6d1
#f2e2d9
#ffffff
#f4b69c
#f4a09c
#f49cc8
#c69cf4
#a39cf4
#9cc2f4
#9ce5f4
#9cf4df
#9cf4a7
#d4f49c
#f4f19c
#f4dc9c
#f4c89c
#e3c0ac
#e4e4e4
#ee8f66
#ee6d66
#ee66aa
#a866ee
#7166ee
#66a1ee
#66d7ee
#66eece
#66ee78
#bcee66
#eee966
#eeca66
#eeaa66
#d59f80
#b4b4b4
#e86830
#e83a30
#e8308c
#8930e8
#4030e8
#3080e8
#30c9e8
#30e8bd
#30e849
#a5e830
#e8e230
#e8b730
#e88c30
#c67d53
#848484
#c74b16
#c71f16
#c7166f
#6c16c7
#2516c7
#1663c7
#16a9c7
#16c79e
#16c72e
#86c716
#c7c116
#c79816
#c76f16
#a66037
#545454
#913710
#911710
#911051
#4f1091
#1b1091
#104891
#107c91
#109173
#109121
#629110
#918d10
#916f10
#915110
#794628
#242424
#5c230a
#5c0e0a
#5c0a33
#320a5c
#110a5c
#0a2e5c
#0a4e5c
#0a5c49
#0a5c15
#3e5c0a
#5c590a
#5c460a
#5c330a
#4d2c19
#000000
Clear
Timeframe
Select a Timeframe
Select a Timeframe
This Past Week
This Past Month
This Past Year
All Time
Now
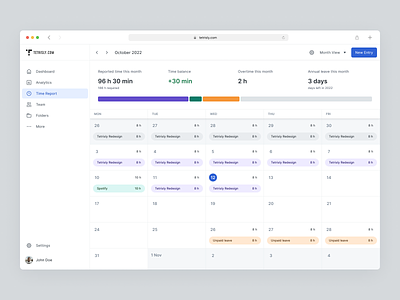
View Time Report - Tetrisly Design System
Time Report - Tetrisly Design System
Like
Tetrisly
Team
Like
763
328k
Shot Link
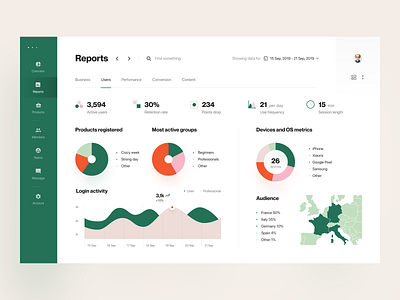
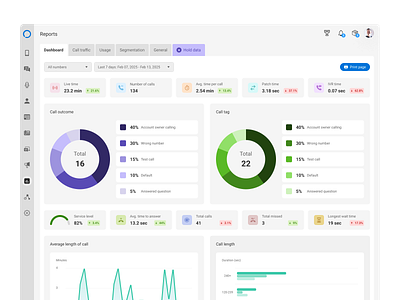
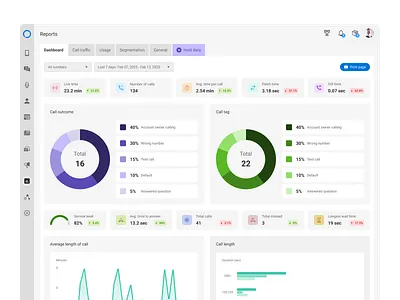
View Product Analytics: Reports
Product Analytics: Reports
Like
heartbeat
Team
Like
1.7k
461k
Shot Link
View Spend Management - Reports
Spend Management - Reports
Like
Brex
Team
Like
310
129k
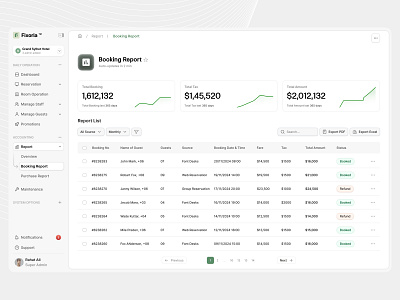
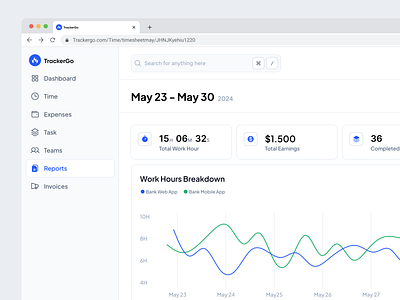
View Hotel Booking SAAS - Booking Report UI
Hotel Booking SAAS - Booking Report UI
Like
Fixoria Studio
Team
Like
25
4.8k
View Data table with report panel
Data table with report panel
Like
Brandby
Team
Like
59
34.6k
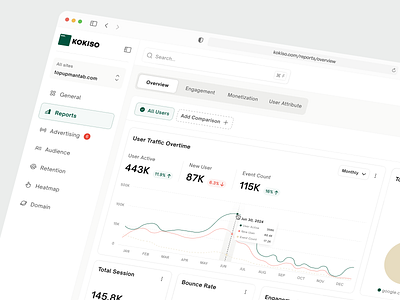
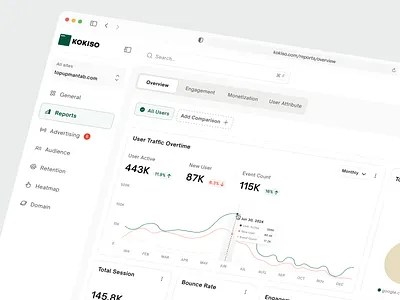
View Report Overview - Analitycs Website Dashboard
Report Overview - Analitycs Website Dashboard
Like
Faris🤘
Pro
Like
37
3.4k
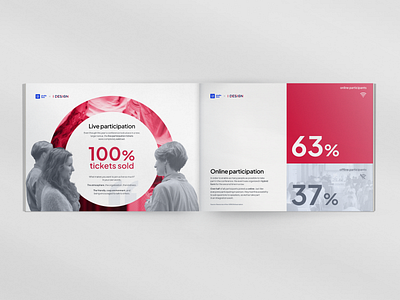
View I DESIGN Report
I DESIGN Report
Like
studio2wx
Team
Like
14
2.3k
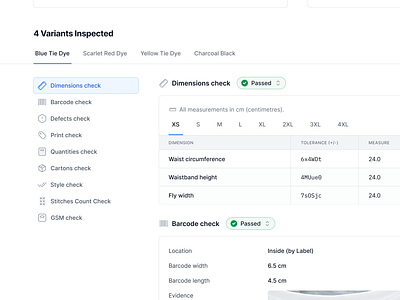
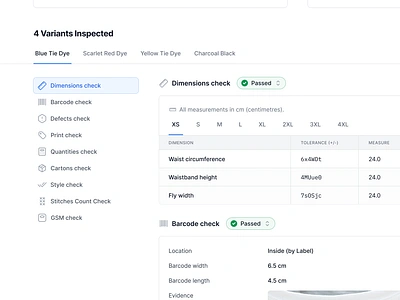
View Quality Control Report - Tabbed Detail Page
Quality Control Report - Tabbed Detail Page
Like
usrnk1
Pro
Like
565
332k
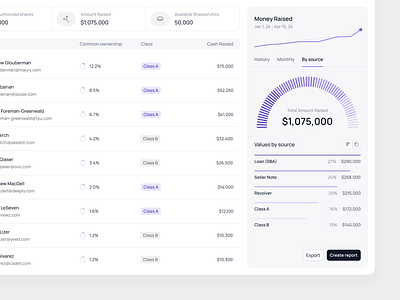
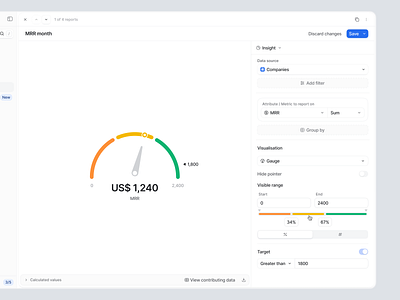
View Attio – Reporting Gauge visualization Exploration
Attio – Reporting Gauge visualization Exploration
Like
Attio
Team
Like
254
69.1k
1
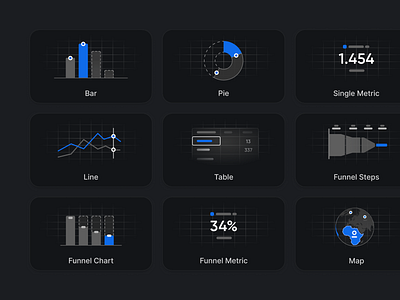
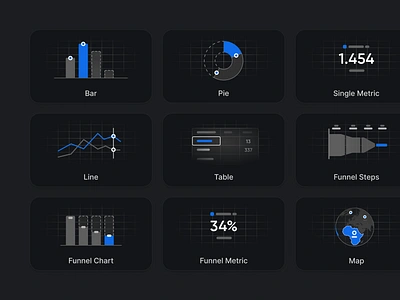
View Attio – Report Type Illustrations
Attio – Report Type Illustrations
Like
Attio
Team
Like
1k
314k
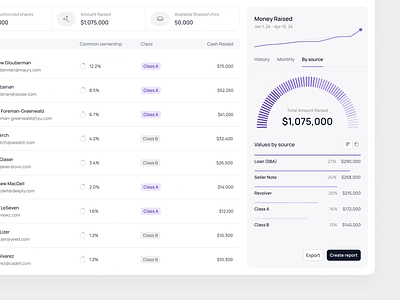
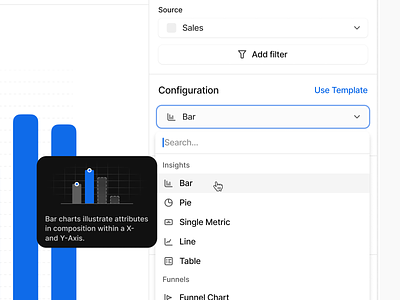
View Attio – Report Creation
Attio – Report Creation
Like
Attio
Team
Like
626
298k
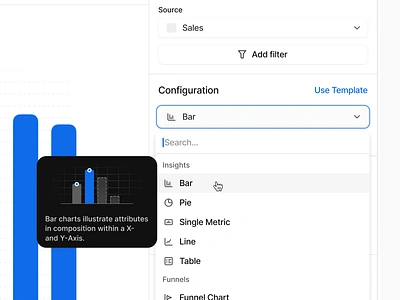
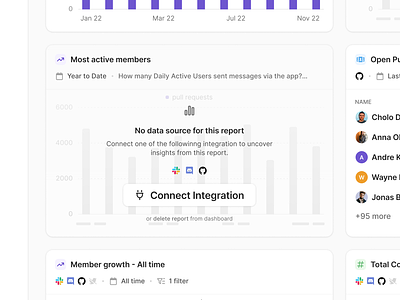
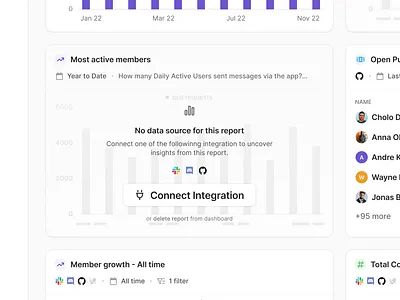
View Handling Reports with Missing Data Sources on Dashboard
Handling Reports with Missing Data Sources on Dashboard
Like
usrnk1
Pro
Like
330
183k
1
View Shown AI · Dark mode · Reports
Shown AI · Dark mode · Reports
Like
Juliette Lagache
Pro
Like
27
7k
1
View Reports ⇒ Project Tracker
Reports ⇒ Project Tracker
Like
10am Studio
Team
Like
74
18.1k
View SaaS B2B - Reports Dashboard
SaaS B2B - Reports Dashboard
Like
Paweł Kopciński
Pro
Like
13
2.9k
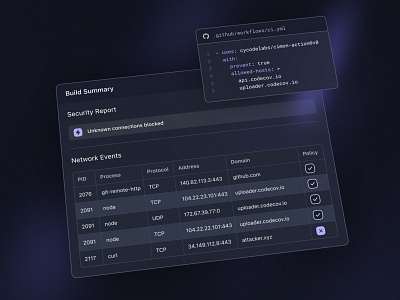
View Security Report
Security Report
Like
Cycode Design Team
Team
Like
20
8.4k
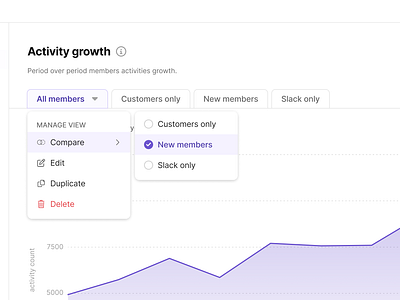
View Report View - Compare Views Exploration
Report View - Compare Views Exploration
Like
usrnk1
Pro
Like
57
42.9k
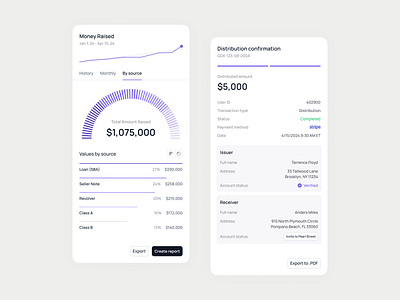
View Finance & Banking Side Panels - Report & Confirmation
Finance & Banking Side Panels - Report & Confirmation
Like
Brandby
Team
Like
16
8.5k
Shot Link
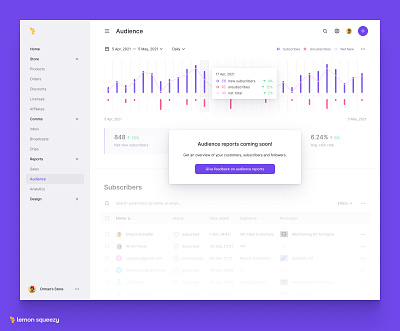
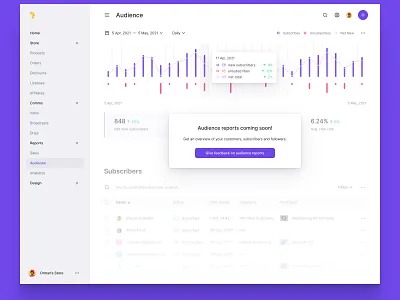
View Audience Reports
Audience Reports
Like
Lemon Squeezy
Team
Like
153
66.7k
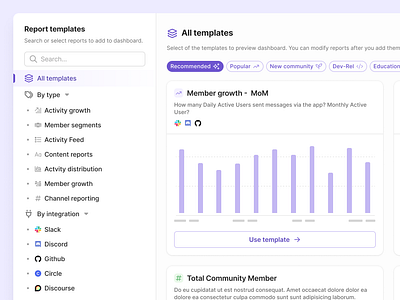
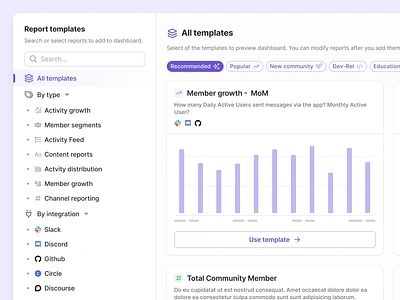
View Report Templates Directory Dialog with Report Previews
Report Templates Directory Dialog with Report Previews
Like
usrnk1
Pro
Like
139
88.8k
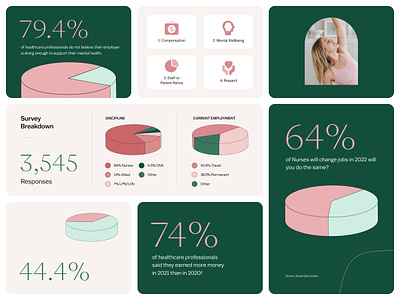
View Future of Healthcare Work Report
Future of Healthcare Work Report
Like
Vivian Health
Team
Like
11
3.9k
Shot Link
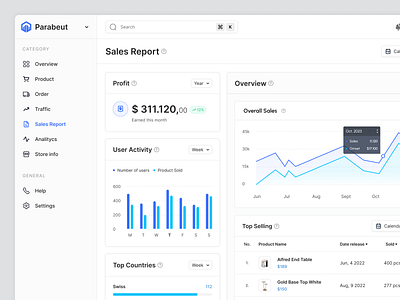
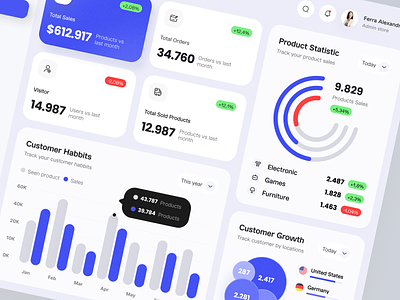
View Sales Report Dashboard - Parabeut
Sales Report Dashboard - Parabeut
Like
10am Studio
Team
Like
515
274k
View Dealdeck - Sales Report Dashboard
Dealdeck - Sales Report Dashboard
Like
One Week Wonders
Team
Like
590
171k
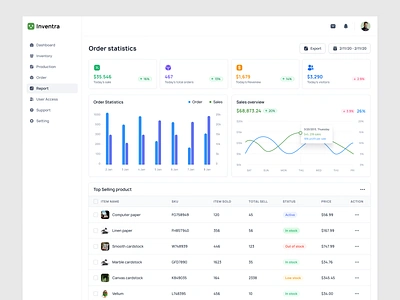
View Inventory Report
Inventory Report
Like
Faysol Ahmed Sozib
Pro
Like
38
10.2k
← Prev
Next →
Sign up to continue
Loading more…
Previous
Next
Loading…