Analytics Chart for runner's dashboard
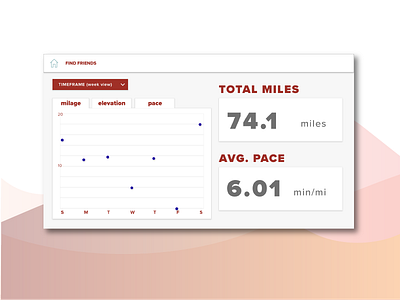
idea: hovering over the points on the chart will show the exact metric.
Toggle between week view, month view, or day view to see more detailed breakdowns or aggregates. This will change the metrics on the graph, as well as the summations and averages on the righthand side.
Flip between charts to see mileage, elevation gain/loss, and pace breakdowns.
