Stock Viz
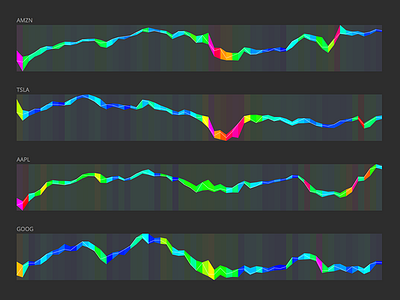
Another stock chart to help you lose money faster. Color represents volume (low=blue to high=magenta). Width of line is range of high to low price during the day.
Another stock chart to help you lose money faster. Color represents volume (low=blue to high=magenta). Width of line is range of high to low price during the day.
