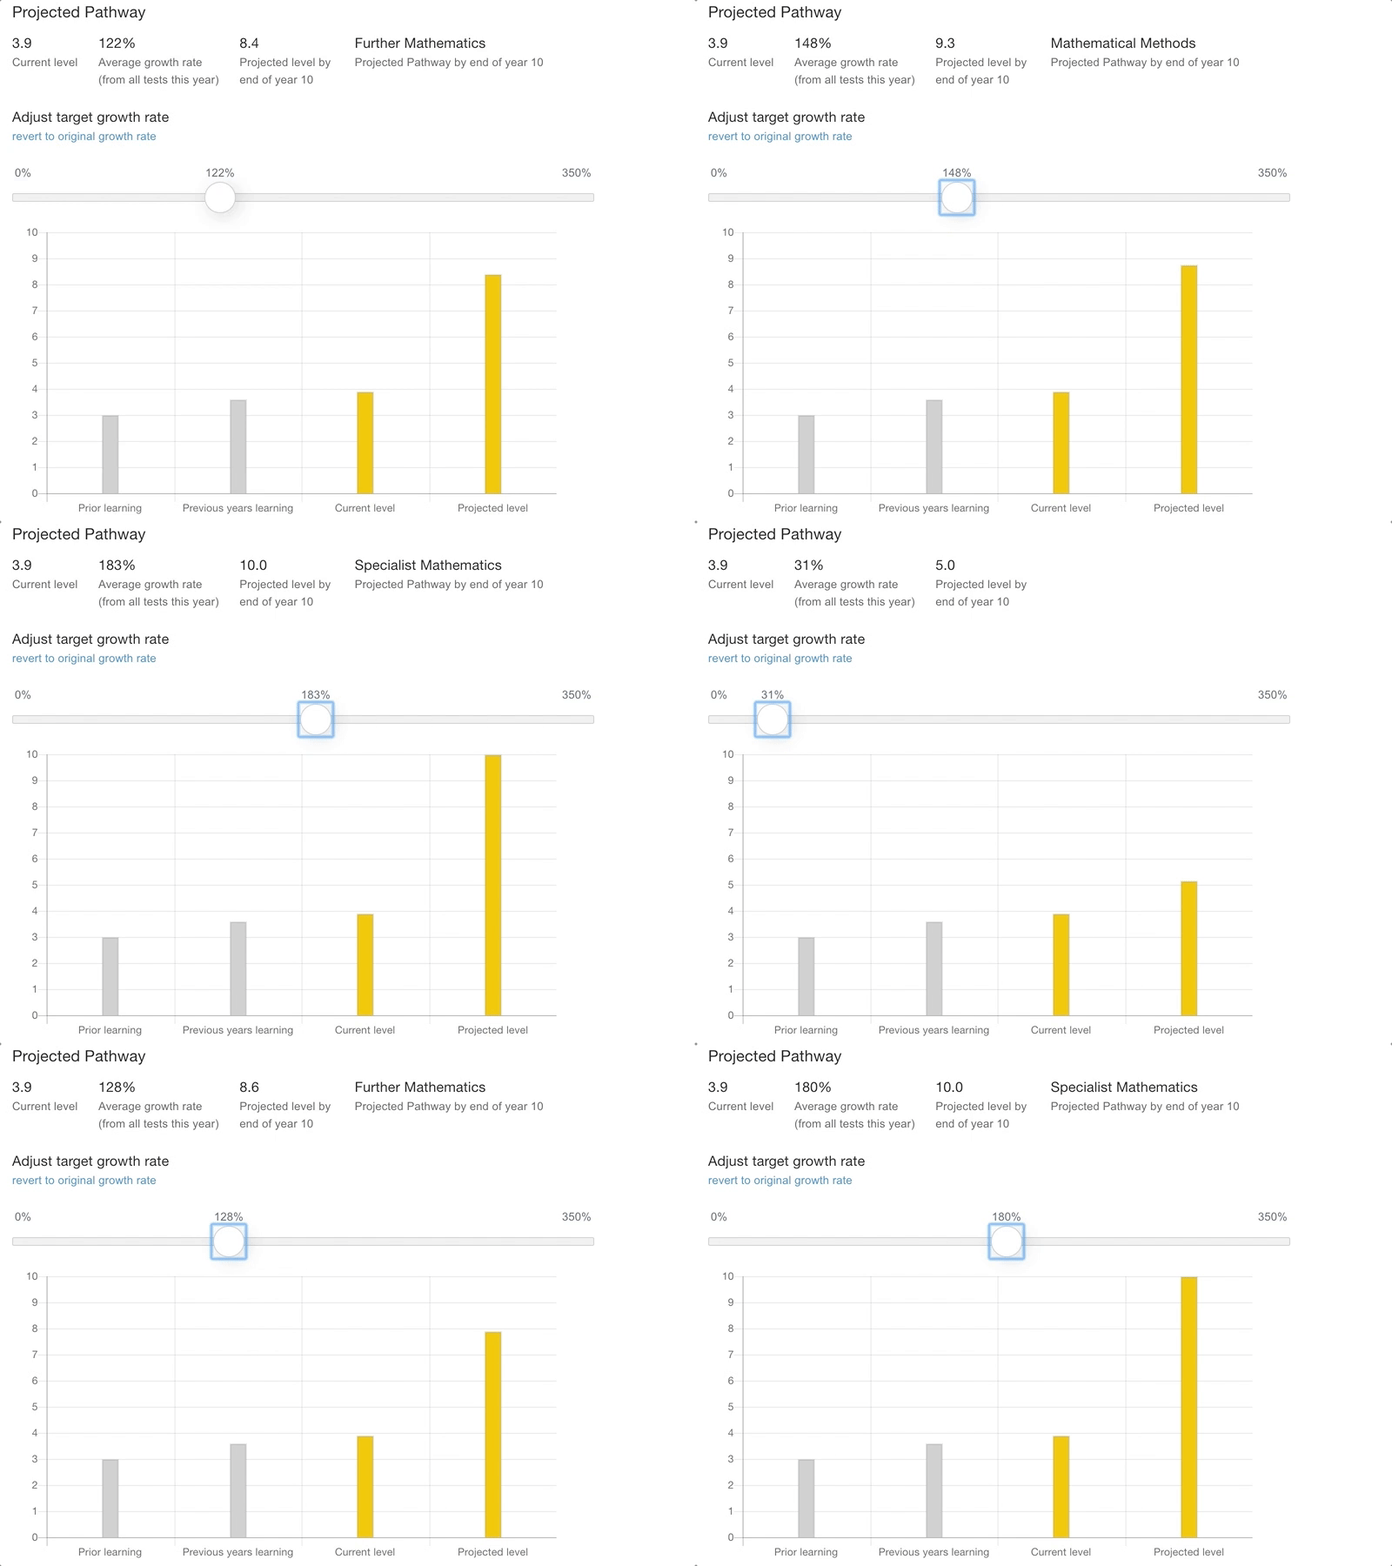
📊 Chart and slider UI design
THIS was fun to work on. This chart shows the "Current level" of a student. The slider adjusts their growth rate which then projects what level of mathematics they will reach by the end of year 10.
Super cool. The chart is driven by chart.js, not sure about the slider.
Gif recorded straight from production 😏 💻 ✨
More by Philip Ardeljan View profile
Like
