Data Visualization | Motion Graphics
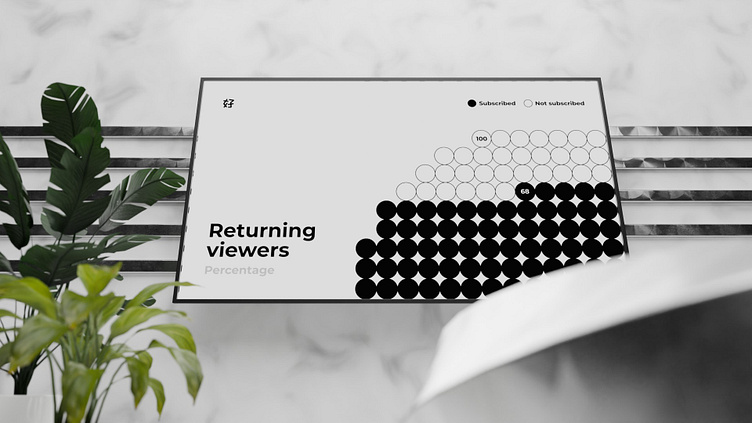
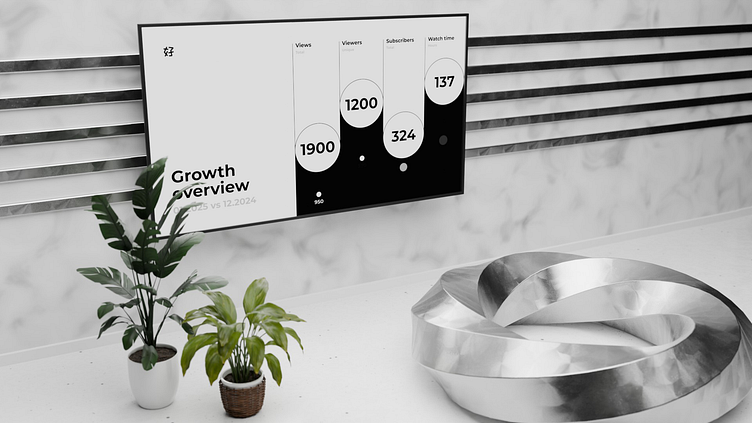
Looping infographic animation showcasing mock YouTube channel stats. Designed in Affinity Designer, animated in After Effects, and presented within a 3D mockup created in Blender and rendered in Cycles.
Check out my music on YouTube and follow me on Instagram for updates! Music and visual asset licensing through Motion Array. Free visual assets can be downloaded from my Unsplash.
