Logistics Dashboard
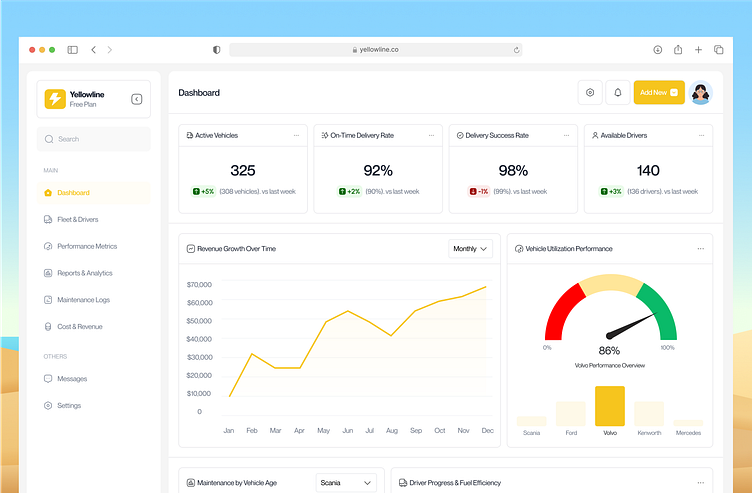
This logistics dashboard homepage brings together all the essential insights you need in one visually engaging and highly interactive space.
At the top, you’re greeted with quick, actionable stats like Active Vehicles, On-Time Delivery Rate, Delivery Success Rate, and Available Drivers. With just a glance, you know how your fleet is performing—no endless clicks or hunting through reports.
Move down, and the Revenue Growth Over Time chart takes center stage, presenting trends in your earnings with clarity. Whether you’re planning budgets or tracking performance, this chart is your go-to for financial insights.
On the side, the Vehicle Utilization Performance chart shows how effectively your fleet is being used.
Paired with a Population Pyramid chart breaking down maintenance patterns by vehicle age. Legends like "Under Maintenance" and "Recent Repairs" keep it intuitive and easy to read.
Adding a personal touch, the Driver Progress & Fuel Efficiency section uses wafer charts to show fuel levels at a glance. Driver performance cards give you detailed updates without being overwhelming.
Finally, everything wraps up neatly in the Fleet Operations Overview table, where you’ll find all the nitty-gritty details:
Vehicle ID, Truck Type, Driver Name, Status, ETA, Delivery Progress (%), Flagged Issues
This design doesn’t just look polished—it’s built to simplify fleet management and keep you informed at every step. Whether you’re overseeing deliveries, evaluating driver performance, or monitoring maintenance, this dashboard has been crafted to make your workflow smoother, smarter, and more efficient.
🔥 Open for Exciting Projects: If this design aligns with your vision, I'd love to collaborate on your next big idea. Let’s create something extraordinary together! Reach out at [email protected]
❤️ Appreciate the design? Your likes and comments fuel my creativity! Feel free to share your thoughts below!


