Data Analysis: Insights, Techniques, Chart design

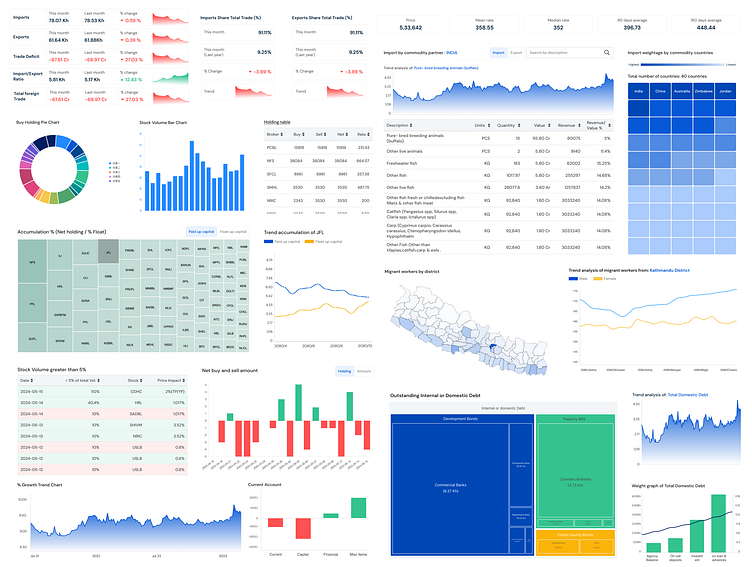
Exploring the intersection of design and data analytics through compelling visualizations. 📊 Dive into how we transform raw data into actionable insights, driving informed design decisions. From user behavior trends to performance metrics, see the power of data in shaping intuitive user experiences.