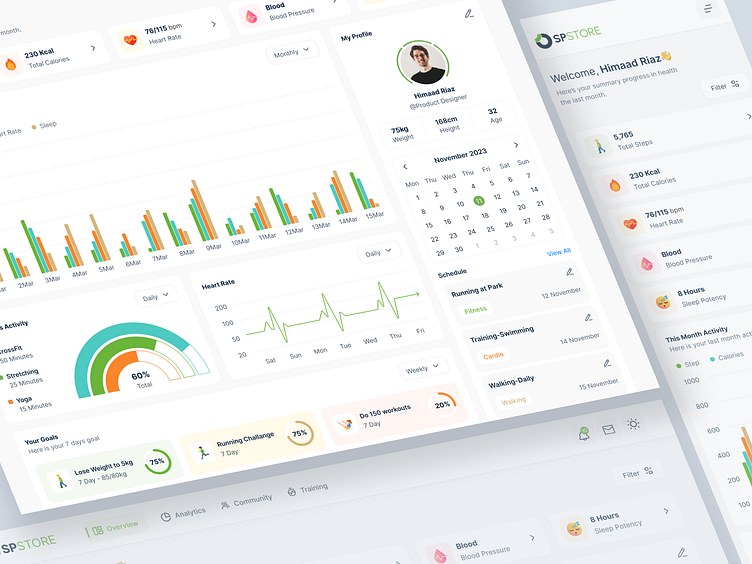
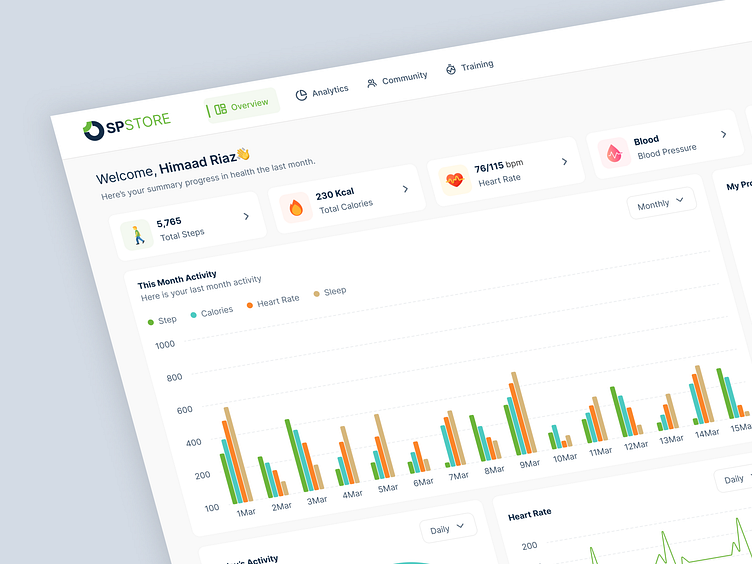
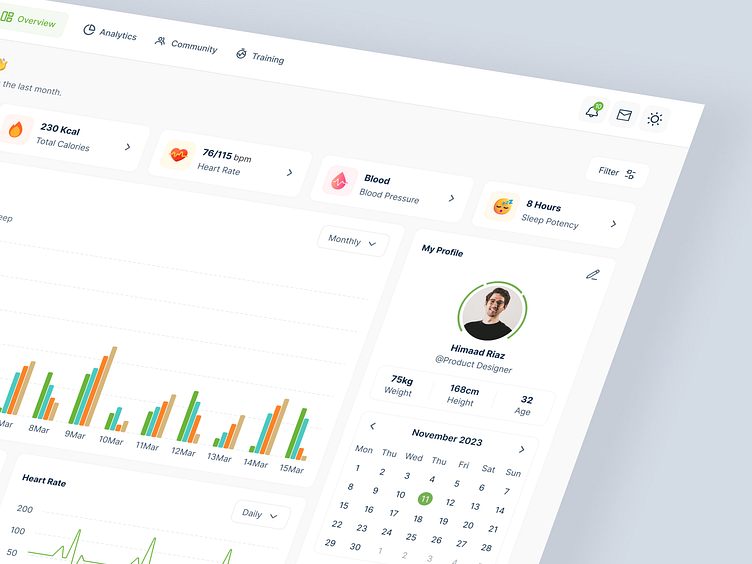
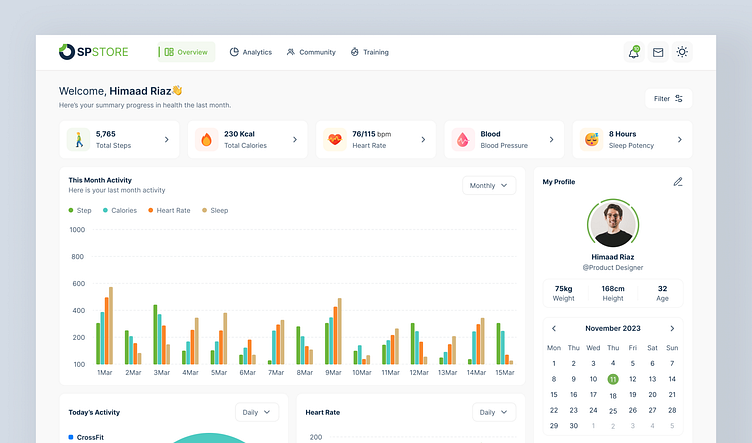
Data Visualisation Dashboard
Hello👋
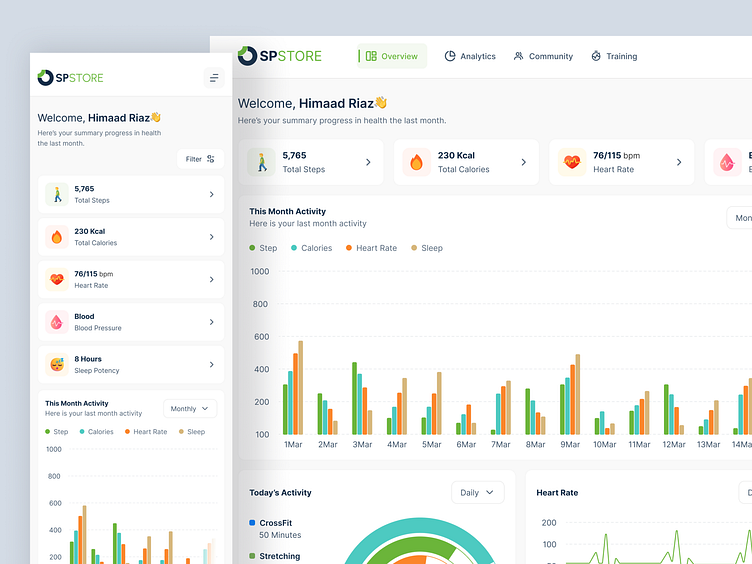
A data visualization dashboard is a powerful tool designed to help users make sense of complex data through visual representation. These dashboards consolidate various data sources into a single interface, enabling users to monitor key performance indicators (KPIs), identify trends, and gain insights that drive informed decision-making.
Click "Like" to express your appreciation ❤
🧑💻Available for freelance hire and full-time remote positions. For inquiries, please contact 💌 [email protected]
Follow me on👇🏻