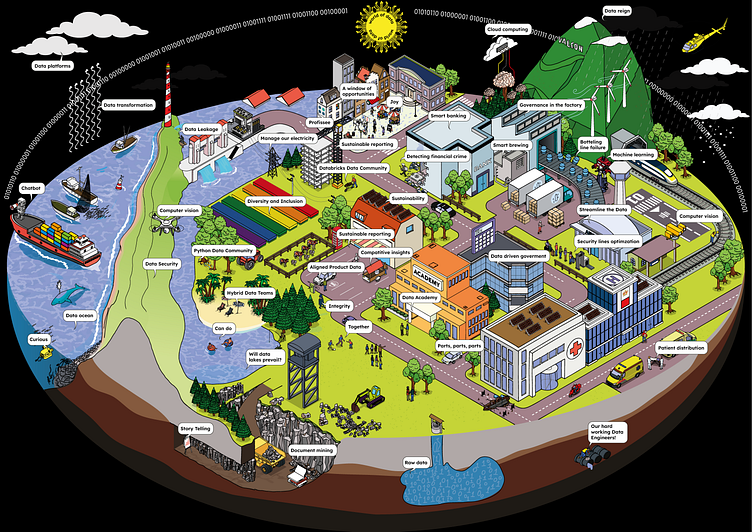
'World of Data' - infographic
Initially, ‘the Land of Data’ was conceptualized around the Dutch landscape. The idea of visualizing ‘data’ as ‘water,’ given the water-rich character of the Netherlands, quickly emerged. Water, with its many forms from purification to pollution, seemed a fitting metaphor for the flow of data.
In this context, the flow of data was represented by water streams, featuring elements like clouds, rainfall into lakes, polders, windmills pumping water, aqueducts, harbors, seas, and dikes, as well as everyday aspects such as farms, roads, trains, factories, and airplanes.
Raw data was depicted as groundwater, a leak in the dike as a data leak, and clouds served as data platforms. With these symbols, the initial sketch of ‘the Land of Data’ was realized.
As the project evolved, it transitioned into a more global ‘World of Data,’ with an international character and less emphasis on a typical Dutch landscape. The NS train became a European train, the KLM airplane disappeared, the windmill was removed, and the Escher building was replaced.
