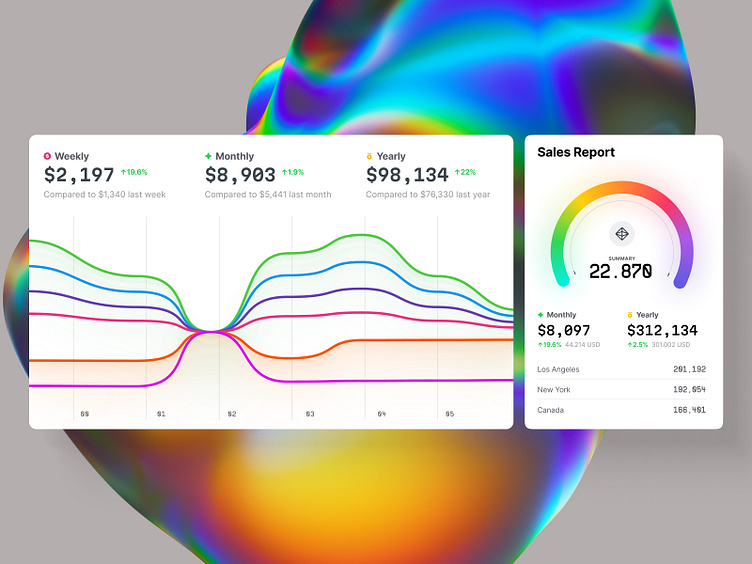
Impactful Data Visualizations
Hyper Charts includes over 1000 of editable graphs in blocks, making it easy to create stunning and professional-looking visualizations for any project. The graphs are fully customizable, so you can change the colors, fonts, and styles to match your brand or project theme. The kit also includes a variety of chart types, so you can find the ideal graph to match your data.
Features:
1000+ editable blocks and graphs to choose from, giving you total creative freedom.
Scalable charts that adapt to any screen size or device, allowing for an optimal viewing experience.
Designed with a focus on UI details, providing you with polished, refined charts.
Compatible with dark mode, adding an extra layer of sophistication to your designs.
Time-saving UI kit and perfect for developing and honing your design skills.
