Data visualization app UI-kit | Heatmap
Hi guys ⚒️
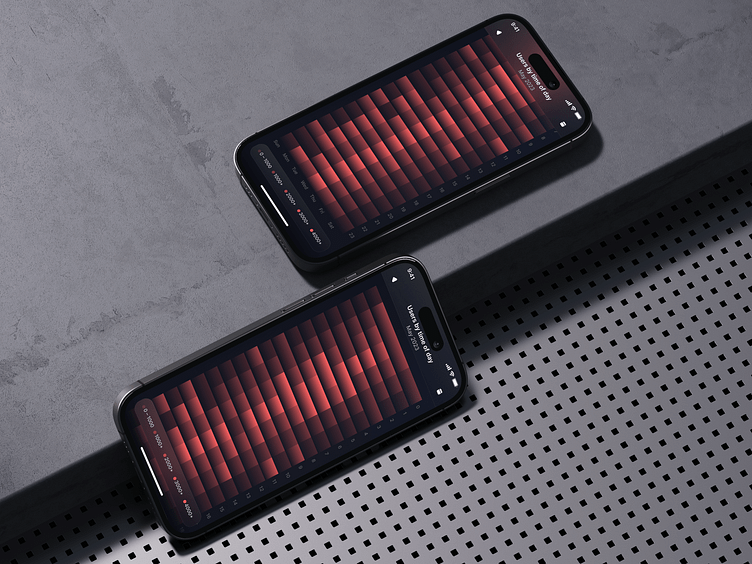
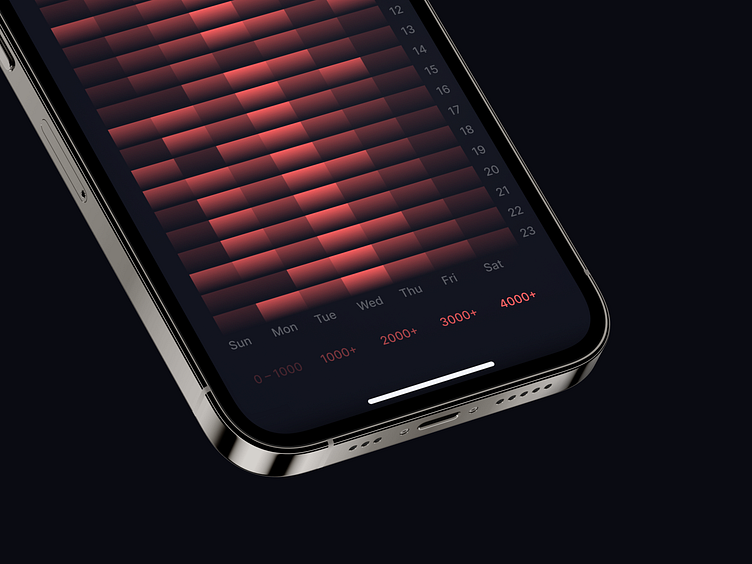
I want to share a little update of mine Data visualization app UI-kit. In version 1.21 I added new heatmap variations. These heatmaps display the number of users depending on the time of day, but you can easily reconfigure them to your needs.
UI-kit is contains 56 screens and 75 ready-made data display components. Radial Bar Charts, Angular Gauges, Donut Charts, Bar Charts, Line Graphs, Progress bars, Card Widgets, iOS Widgets and more to display any type of data. Best for financial, crypto, banking and sports app.
UI-kit is designed using auto-layout, components and variants, allowing you to quickly edit screens and create new ones. The design system has equipped typography, color styles, iconography and components. Made with Free Google font pair.
Data visualization app UI-kit gives you well organized symbols and layers with clear structure.
Get it on Gumroad

Get it on Gumroad