Data Visualization
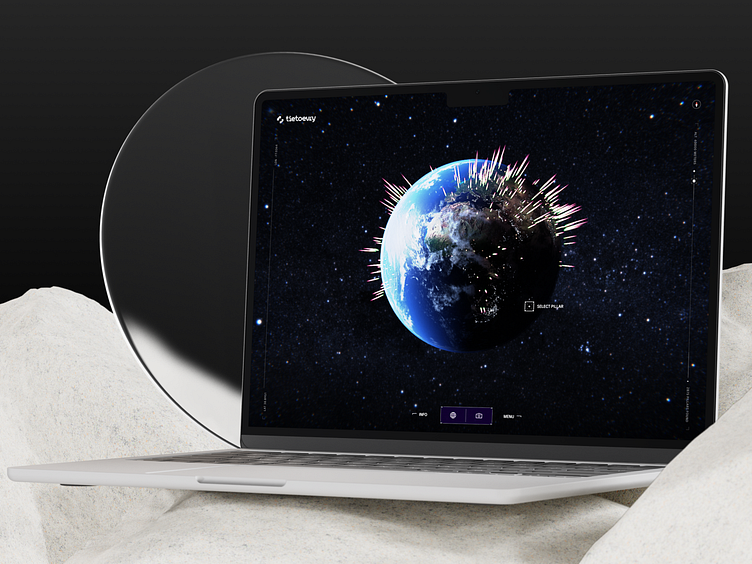
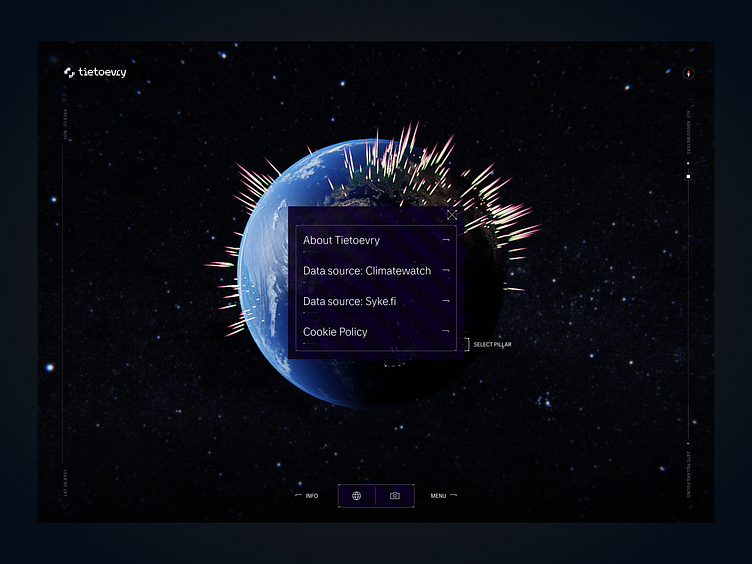
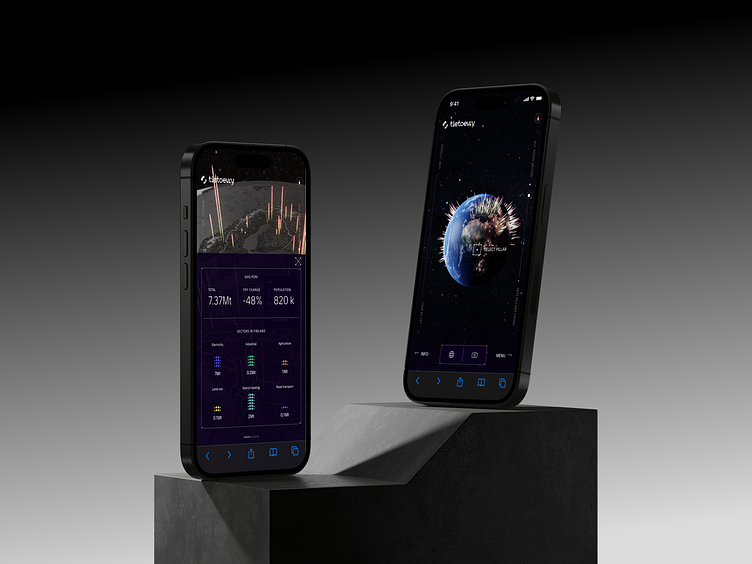
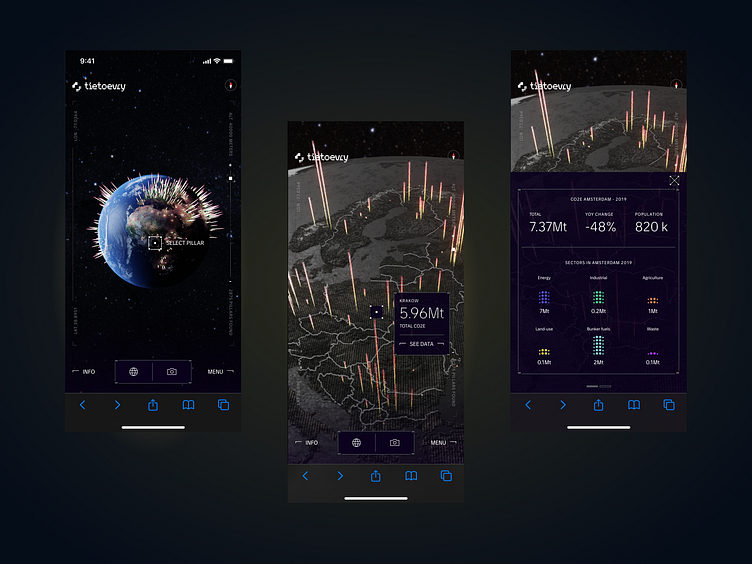
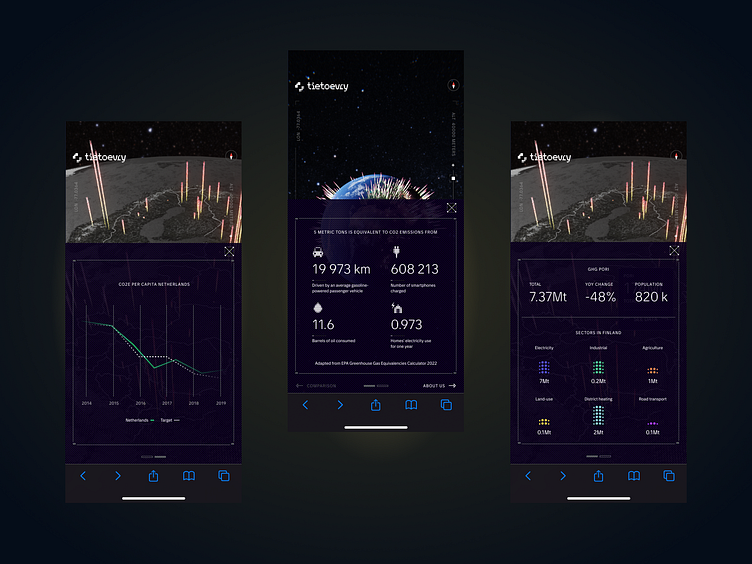
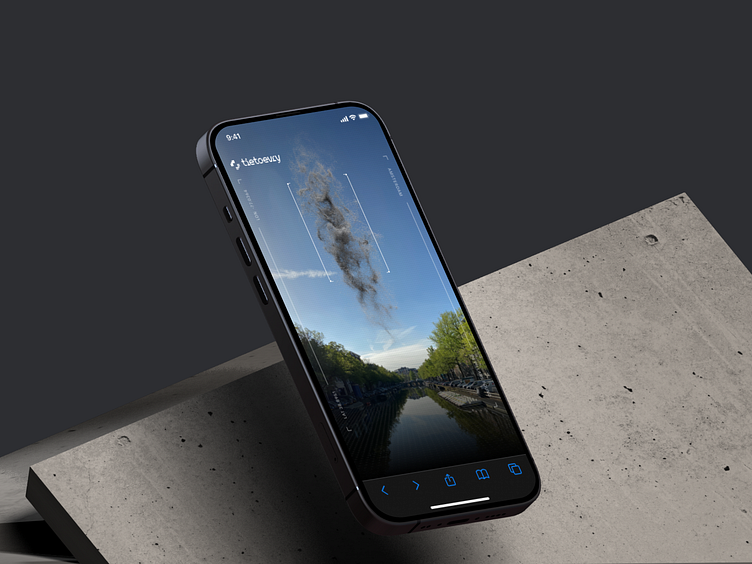
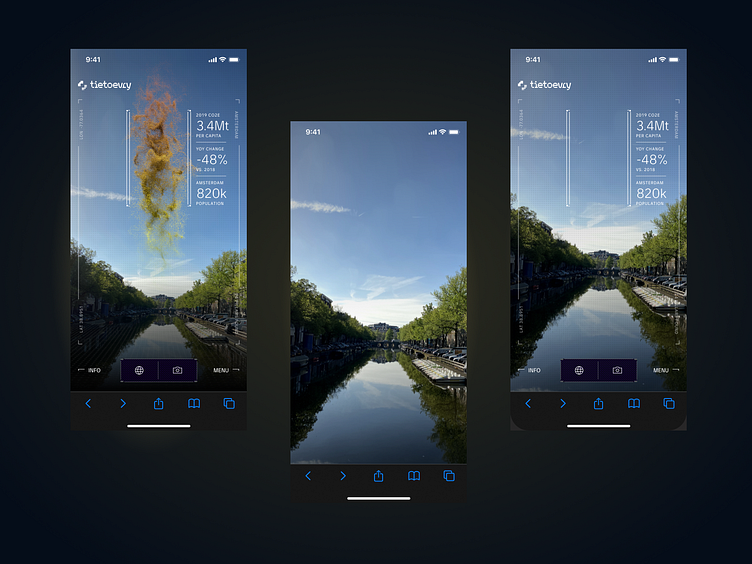
Tietoevry's Carbon Globe Chart is an initiative that turns planet into an interactive data visualization.
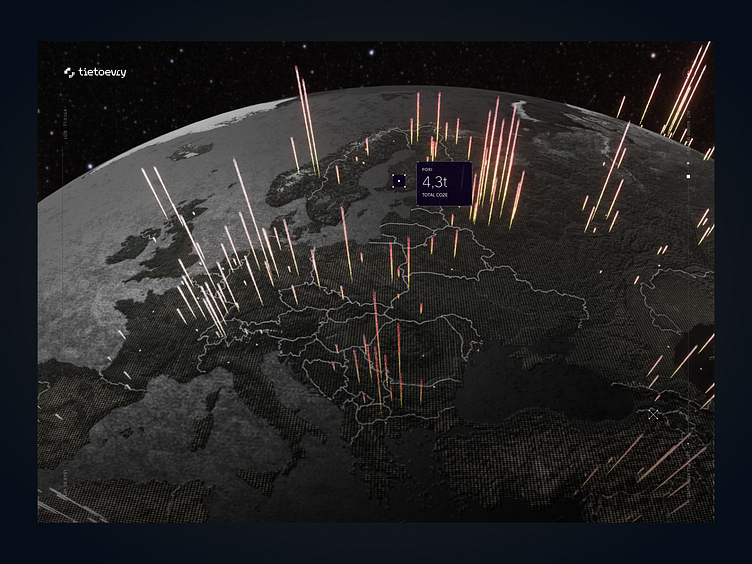
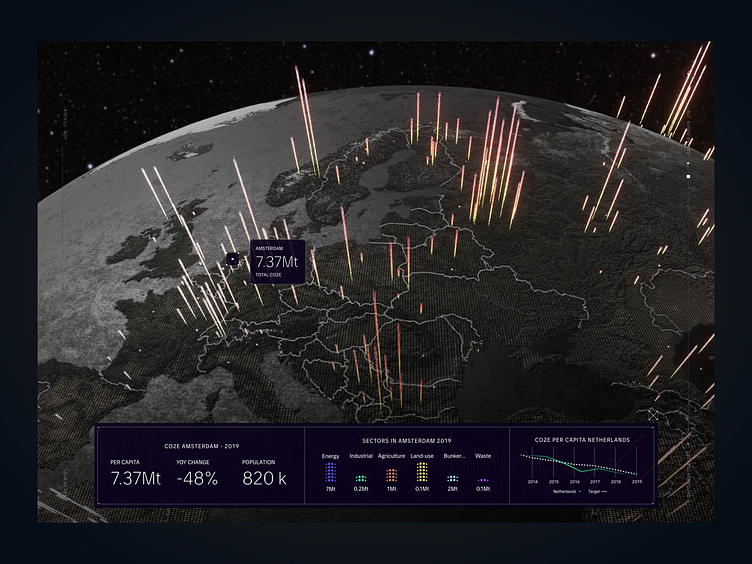
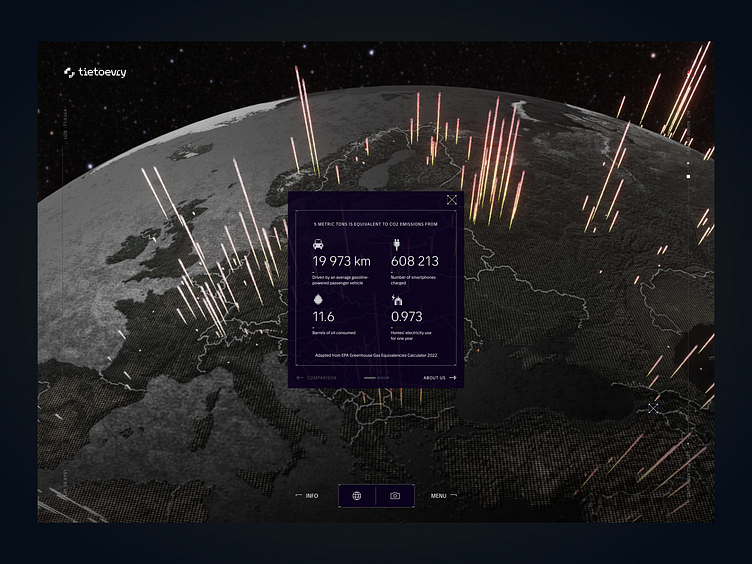
Follow the link and explore worldwide sources of carbon emission by countries and cities in the globe view, and see locally relevant climate data in the nearest horizon by simply holding up your phone in the AR view.
Along with the latest available data, carbon Globe Chart shows yearly trends and comparison values to help you understand the differences in scale.
We're itching to hear your thoughts, so don't be shy and drop us a comment below! Plus, if you're interested in teaming up on an exciting project or have any questions, we're all ears 👂. Simply reach out to us here
Credits:
Adventure Club
TBWA
Juhana Hokkanen
Mikko Pietilä
Maria Kuorikoski
Jere Saulivaara
Joona Stedt
Sebastian Holm
Iida Sarpaniemi
Sofia Heinonen
Hanna Heikkilä
Tietoevry
Kia Haring
Nelli Melin
Jonna Peltola
Hanne Haapoja
Mari Tuokko
Reija Sihlman
