Power BI Product Sales Report

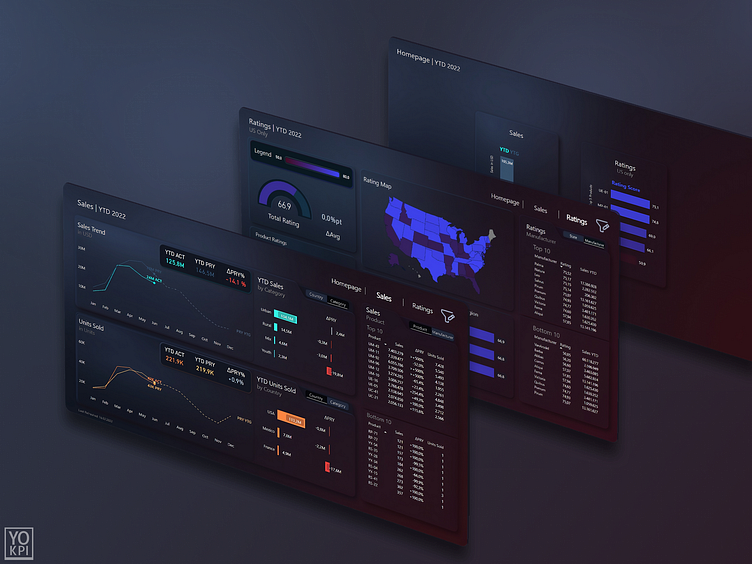
This is an interactive product sales report created in Power BI. It has three pages, a Homepage, a Sales page and a Ratings page. The design was made in Figma.

The Homepage shows the most important KPI's and allows the user to navigate to the Sales and Ratings pages.

Enter your text here...The Sales page shows the year-to-date (YTD) sales trend aswell as the units sold in a similar fashion. It makes it easy to draw comparisons and see correlations between the two KPI's.
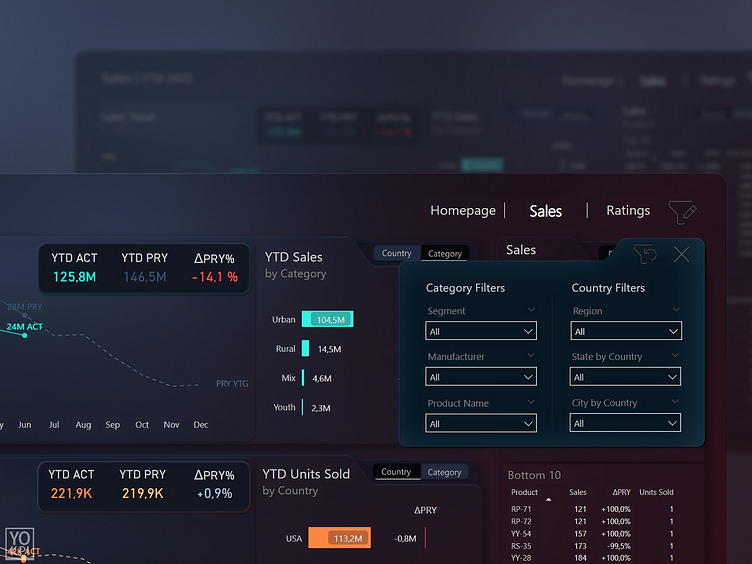
The report has a built-in filter pane which allows the user to slice and dice the report across various dimensions.

The Ratings page shows the different product ratings in the US market.
