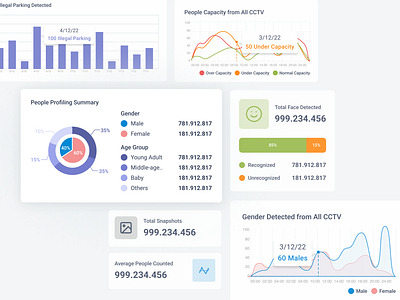
Analytics Chart UI Design
Take a look at these creative and diverse analytics displays, perfect for any dashboard project!
From line graphs to donut charts, these summary data visuals are sure to inspire you to get creative with your own data analytics. Whether you're working with sales figures, user data, or any other type of information, these displays are a great way to showcase your data in a clear and visually appealing way.
If you want to create something great, I'm here to help. Just send me a message!
More by Indah Chairunnisa View profile
Like
