Fixing public transportation for bus-riders in a Midwest City.

2020. Student work.
High-Fidelity prototype of a mobile bus-tracking app.
Check out the prototype here!
Background
Due to the recent expansion of the transportation system of a mid-size city in the Midwest, multiple buses are now stopping at the Washington & State St. stop. Previously, bus riders could confidently rush to the stop and know which bus route they’re taking. Now, 7 different buses all stop at the same station causing frequent confusion leading to frustrations and complaints.
I developed a research plan to gather quantitative and qualitative data to inform my design for possible business solutions. I created various design artifacts and deliverables consisting of, but not limited to, wireframes, sitemaps, and a high-fidelity prototype. I then conducted usability tests, remote and in-person, to validate or correct my design decisions.
Specifications
Client:
Hypothetical Transportation Agency
Scope & Constraints:
4 Week Design Sprint
Remote location
Role:
End-to-end UX/UI Designer
Methods:
User Research
Branding
Hi-fi Prototyping
Usability Testing
Business Requirements
Allow users to tell:
1. Which specific bus is arriving
2. When that bus is arriving
3. How much time they need in order to get to their bus stop
The Challenge
Create a high-fidelity prototype that tackles the business requirements and the common user frustration that occurs at the Washington & State St. stop.
The Solution

Step 1: Research & Discovery
I developed a research plan to gather quantitative and qualitative data to aid the product's design. The methodology helped me define the user, while my recruitment plan was to get as many respondents in my available channels.
Methodology:
Proto-persona
Competitive Analysis (SWOT)
User Survey
2 Interviews
Recruitment plan
Social media
Personal outreach
Slack
Survey Swap
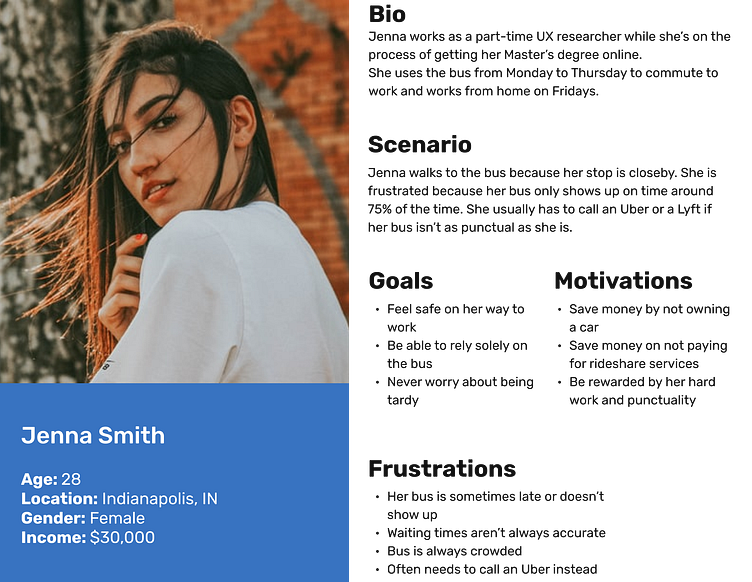
Proto-persona
I created a proto-persona based on the assumptions of my target audience. The perceived goals and pain points are directly referencing the business goals and user frustrations provided by the client.

Competitive Analysis (SWOT)
I conducted a SWOT exercise in order to analyze the strength, weaknesses, opportunities, and threats of the Transit App.

Survey
I launched a Google Forms survey in order to gather quantitative data about how bus riders feel about their city’s transportation system. I posted it on multiple slack channels, social media, Surveymonkey.com and texted it to personal friends. I ended up gathering 42 responses which gave a clearer picture about my target audience and their experiences with public transportation.
Data Insights
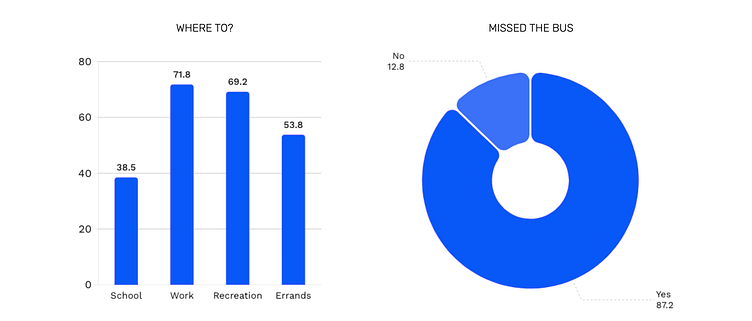
Key Takeaways:
Work is the most common destination for bus riders
Almost 90% of respondents said they’ve missed their bus
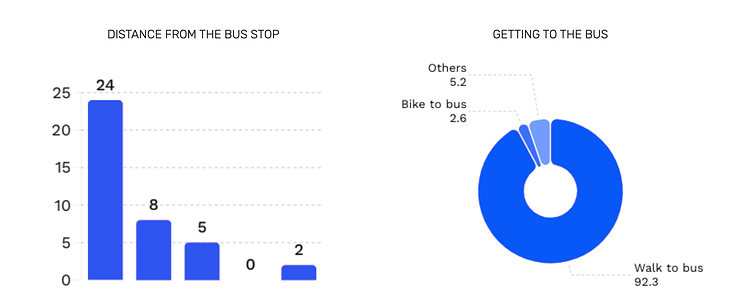
24% of survey respondents indicated that they live very close to their bus stop.
Around 92% of survey respondents indicated that they walk to their bus stop.
By analyzing the answers to the survey, I narrowed down the features I might include in the prototype. A “Favorite Locations” tab or similar would display the top places a user might go to. A feature displaying the walking distance to the bus stop is also necessary.
User Interviews
I conducted 2 user interviews in order to gather some qualitative data about the bus riding experience. I was interested in finding out the reasons why these bus riders rode the bus, their frustrations and delights about the bus system, and ways to improve their experiences.
Interview Insights
Both participants mentioned riding the bus for similar reasons. Cost efficiency and convenience. Being from a big city like San Francisco, they noted that sometimes driving a car is less convenient due to lack of parking. In that case, taking a bus allowed them to get to and from places (almost) hassle free. They also mentioned that taking the bus is often the most affordable option.
One participant mentioned riding the bus in order to contribute funds to the city as well as it being the most environmentally-friendly option. Both participants mentioned using Google Maps when asked if they use any apps for navigation and direction.
When asked about reasons that they had missed their bus in the past, both participants blamed missing their bus due to their app and/or transportation system failings. Participants also reported having been late to their destination because their bus was unpunctual or it simply didn't show up, and they’d end up calling an Uber or Lyft instead.
Research Conclusions
The data I gathered allowed me to define what I’m designing and who I’m designing for. With the new findings, I created personas, journey maps, empathy maps, and user stories to address user problems.
The Frustrated Bus Rider (Personas)
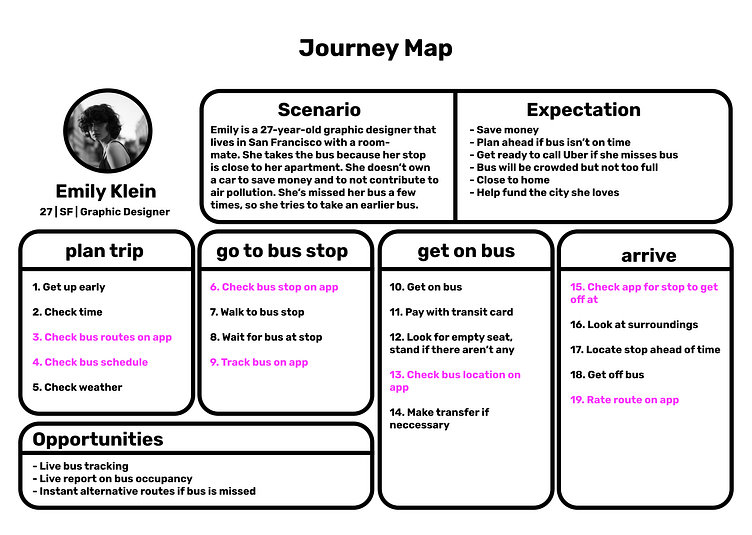
I created two personas based on the quantitative and qualitative data I gathered. This helped me address specific pain points in a bus rider’s journey.

Empathy & Journey Maps
I created an empathy map to display what users feel in their usual bus-riding commute. This helped me find opportunities within the pain and gain points that users experience and implement them in my product.

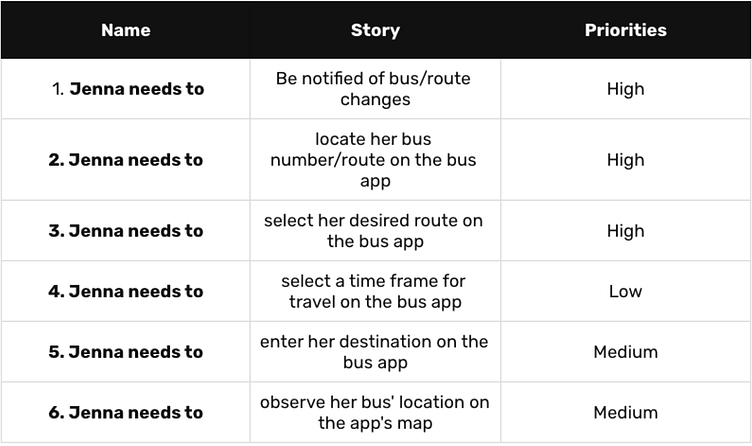
User Stories
I created 5 user stories and ranked them based on priority to the project. The high-priority stories directly correlate with the business need and I chose to focus on them.
Step 2: Ideate
I began to ideate and create different artifacts to help visualize my product idea. I completed the following steps:
Crafted user flows depicting key app functions
Created a site map to establish proper site hierarchy and common groupings.
Created wireframes to display the information architecture and ideas visually.
User Flow
The user flow depicts a user completing the core business requirements:
1. Which specific bus is arriving
2. When that bus is arriving
3. The time required to get to the bus stop.

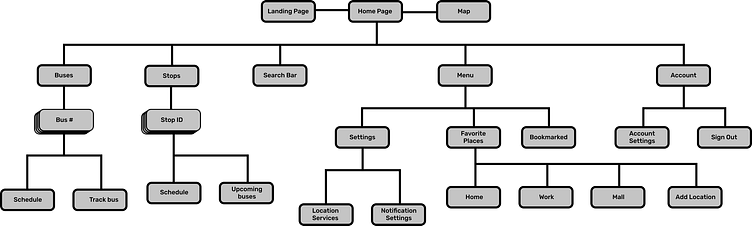
Sitemap
Wireframes
I created 2 versions of wireframes after creating the sitemap. The first ones (first slide) follow my original sitemap which I remade after feedback and testing.

Wireframe Revisions (Second Slide):
1. Got rid of the bottom navigation bar to simplify the user flow.
2. Made “Buses” and “Stops” tabs easily accessible by making them appear on the home page.
Step 3: Developing the Brand
Designing Quickstop
I began this phase by deciding which steps were crucial in the process of developing the Quickstop brand:
Created a moodboard
Created typography guidelines
Came up with a color palette
Sketched and digitally designed Logos. Requested feedback.
Mood board
I created a mood board/style guide hybrid to decide what I want the Quickstop brand to convey to potential users:
Quick
Bright
Simple
Fun
Convenient
Intuitive
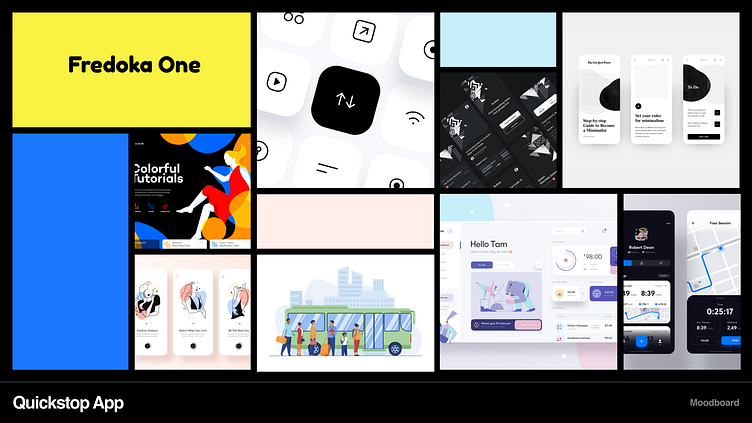
Typography
I chose Fredoka One as the logotype because it displayed the “Fun” characteristic I was opting for. Rubik font paired well with Fredoka One so I chose to use it for UI fonts.

Logos
I then sketched and designed a few logos for Quickstop. I wanted the brand to be easily identifiable for users to infer that this is a transportation app. After multiple designs, I tested the logos by asking for feedback in different slack channels. The top logos (displayed below) allowed me to narrow down my decision.

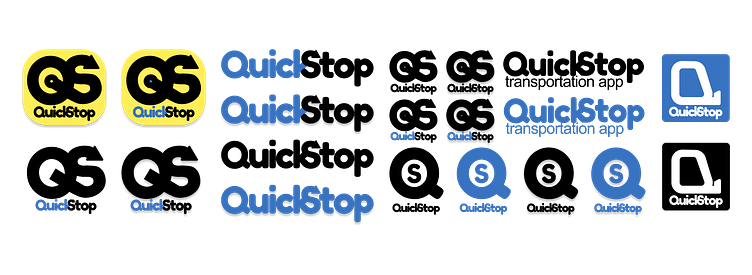
Final Logos

Step 4: The Final Product
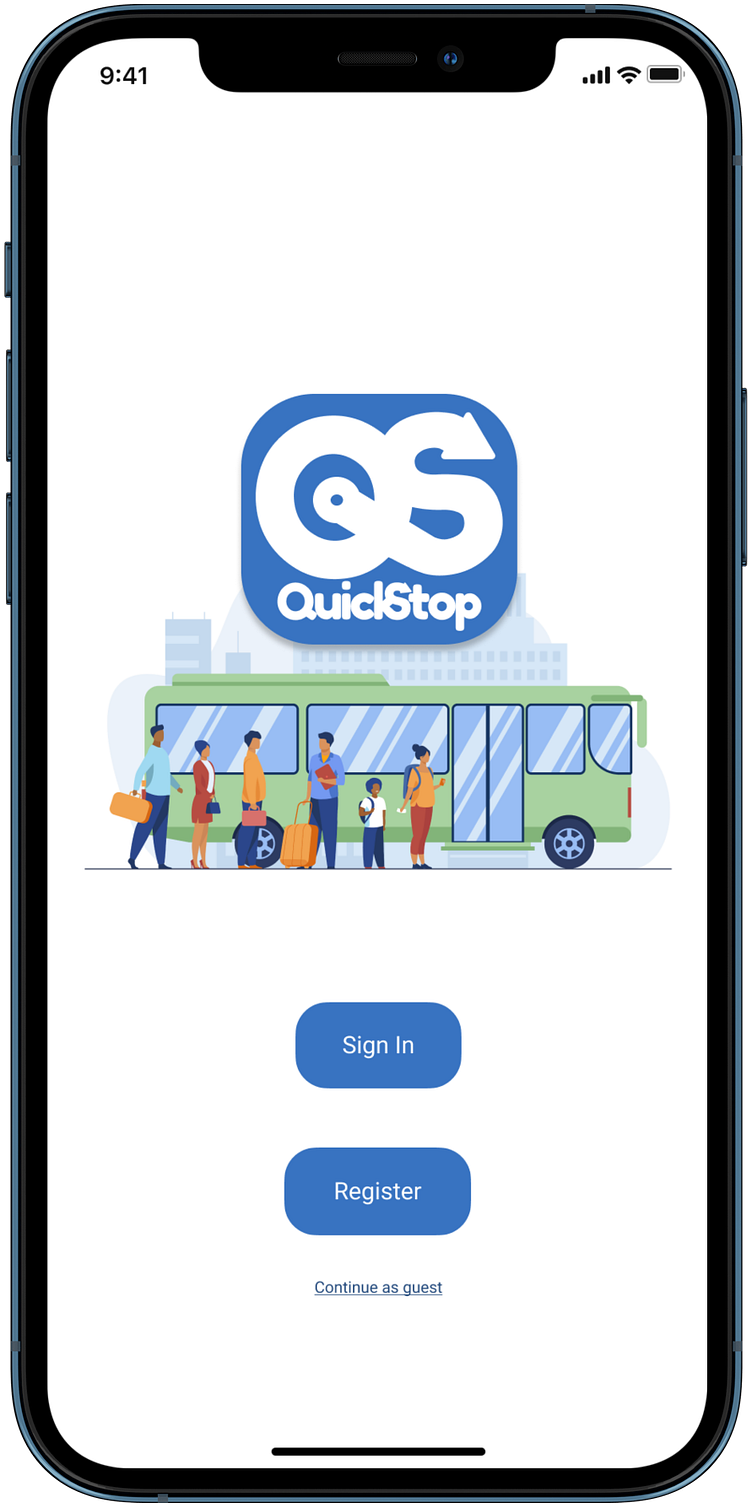
High-Fidelity Mockup
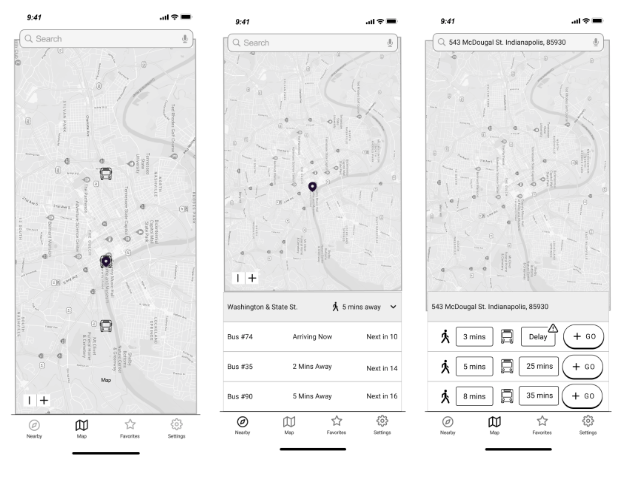
After making revisions based on feedback from my wireframes, I created the high-fidelity prototype. Below are the home page, the opened buses and stops tabs, the Schedule for bus 90, and the active bus tracker.

Some of my design inspo came directly from Google Maps as I wanted to make the app recognizable to allow users to easily navigate the app.
I sourced the bus and bus stop illustrations online and added them in the active tab to add interactivity to the UI.

I made sure to address the business requirements with my design solutions. Now users will be able to tell the following:
What specific bus is arriving
When that bus is arriving
Walking Time ETA
The Interactive Prototype
Here’s the culmination of all the work I put into this project. I created an interactive high-fidelity prototype in order to determine if my design solutions would be validated. I made sure to address the business requirements while designing an aesthetically-pleasing UI. I tested it out with 3 participants and refined it based on feedback.
If you haven’t yet checked out the prototype, make sure to do so here!
Step 5: User Testing
Enter your text here...I conducted 3 usability tests to see which aspects of the app could use refining and which aspects worked perfectly.
I created 5 tasks/scenarios to test out my design solutions directly:
How much time do you have to get to the "Washington & State" stop?
You want to check which buses are coming to the "Washington & State" stop
You want to see where exactly bus 74 is. Track bus 74 on the map.
You want to check bus 90's status.
You want to go to 543 McDougal St. and take the fastest route. Search the address and find your directions.
Observations & Changes
Observations
Each user took under 10 seconds to complete each task
Each user completed every task in 1-2 taps
Changes
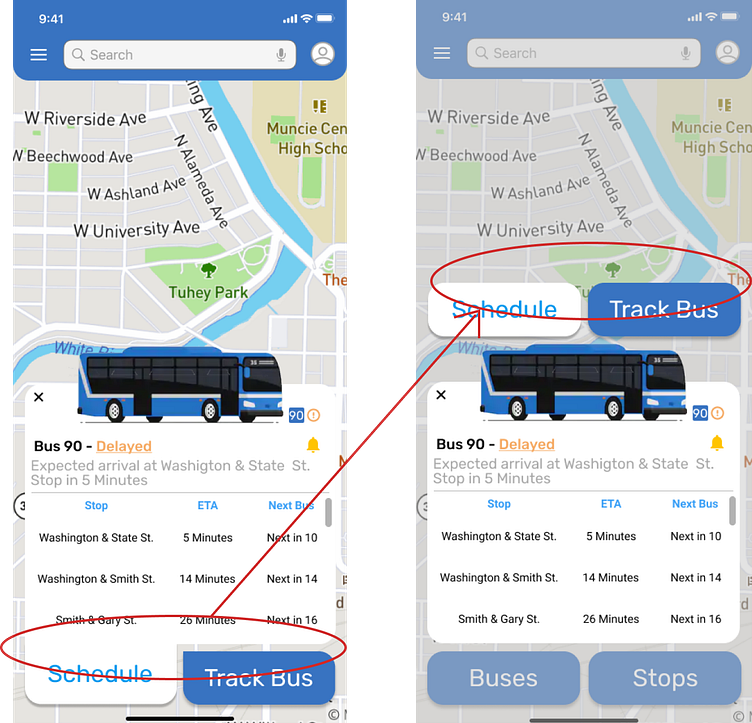
Users were confused when the buses and stops tabs changed to “Schedule” and “Track Bus” after selecting a buses schedule. I changed the positioning of the tabs and added an overlay to avoid confusion.
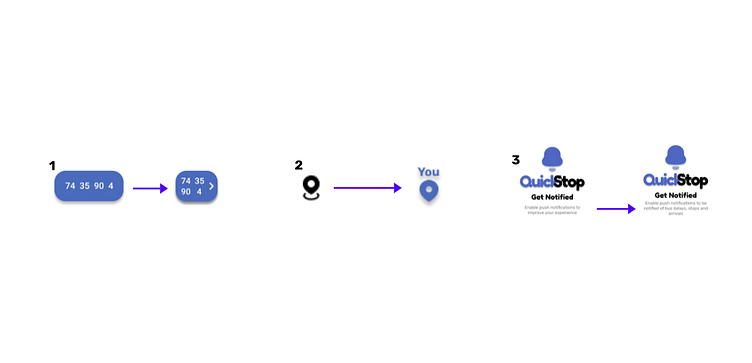
1. Added a call to action arrow to imply that you can view more buses. Before, participants believed all the buses were displayed, but that was incorrect.
2. Added a more descriptive location icon representing the user. Participants were confused about the original icon being them or a stop.
3. Added more descriptive notification prompt. Participant mentioned not turning on notifications for most apps but for this app to work fully, notifications should be enabled.
Step 6: Outcomes & Lessons
The Verdict
I created an aesthetically pleasing mobile application that addressed each one of the business requirements laid out in the prompt.
What I Learned
Simplifying often works best. When initially creating the wireframes, I opted for a bottom navigation bar not realizing that I could use two buttons to accomplish the product requirements. This simple change made the app more accessible and easy to use while reducing unnecessary features.
