Analytics UI Design Day 18

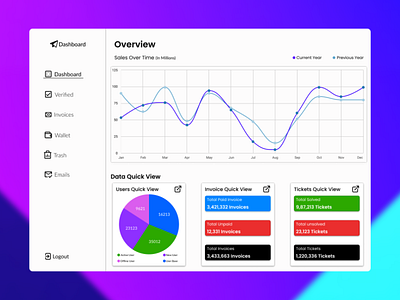
Visualing data with the usages of charts and providing other important information through the usage of cards. This is UI design visualising the sales, tickets, users, along with invoices as well. It's part of the Daily UI Challenge for the Day 18