Pizza forecasting data viz
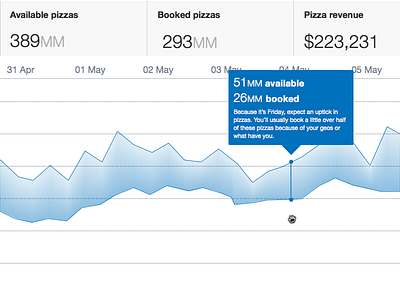
Data visualization for a proprietary forecasting product, hence the fact that everything is represented in Pizzas.
the idea with the gradient was that you could grok the differential in efficiency of your pizza-making by eyeballing the amount of white visible near the top of the curves. the less white there is, the closer the two curves, the better the efficiency.
More by Jahed Momand View profile
Like

