Universal Dashboard

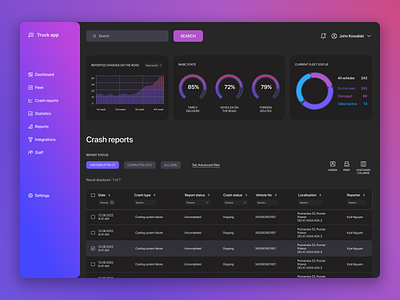
Sometimes we need a comfortable way to represent information with diagrams, tables and stats. The visualisation helps users to understand information faster and make accents. So here is a dashboard with represented data.
Sometimes we need a comfortable way to represent information with diagrams, tables and stats. The visualisation helps users to understand information faster and make accents. So here is a dashboard with represented data.