SMARTHOME/ENERGY

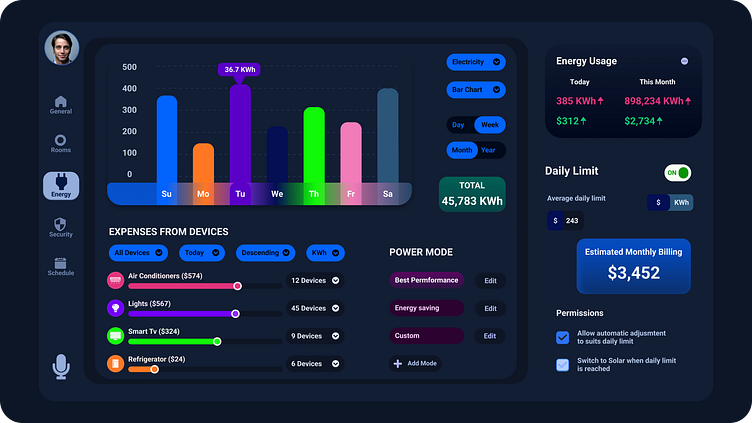
ENERGY DASHBOARD
A set of screens that displays a global overview of actionable relevant data, functions, and controls. Designed in a form of data visualization that aims to give a report or progress to a particular objective or process in the smart home.
Key Features
· Energy production and consumption numbers
· Ensure consumptions don’t exceed acceptable thresholds.
· Equipment functionality and efficiency
· Anticipate next month’s bills with predictive estimates, right from the tooltip
· Solar or electricity? Know exactly how much power, from which source, was spent on ambient conditions maintenance.
· Identify inefficient rooms, which continue to consume power even when used sparingly
· Know each device’s energy consumption, with a dropdown option to choose either ascending or descending (default) in percentage or in power unit (KWh)
· Enable user-tailored permissions.
· Optional dropdown for the user to choose the data chart visualization that seems best to him.
Monitor production and consumption metrics with energy dashboards.
Track energy consumption and production, equipment downtime, and more.
Let’s talk about your project
Services we provide:
· User Interface Design
· Interaction Design
· Website & Mobile Design
· UX Research and UX Design
· Motion interaction
Want to collaborate with me?