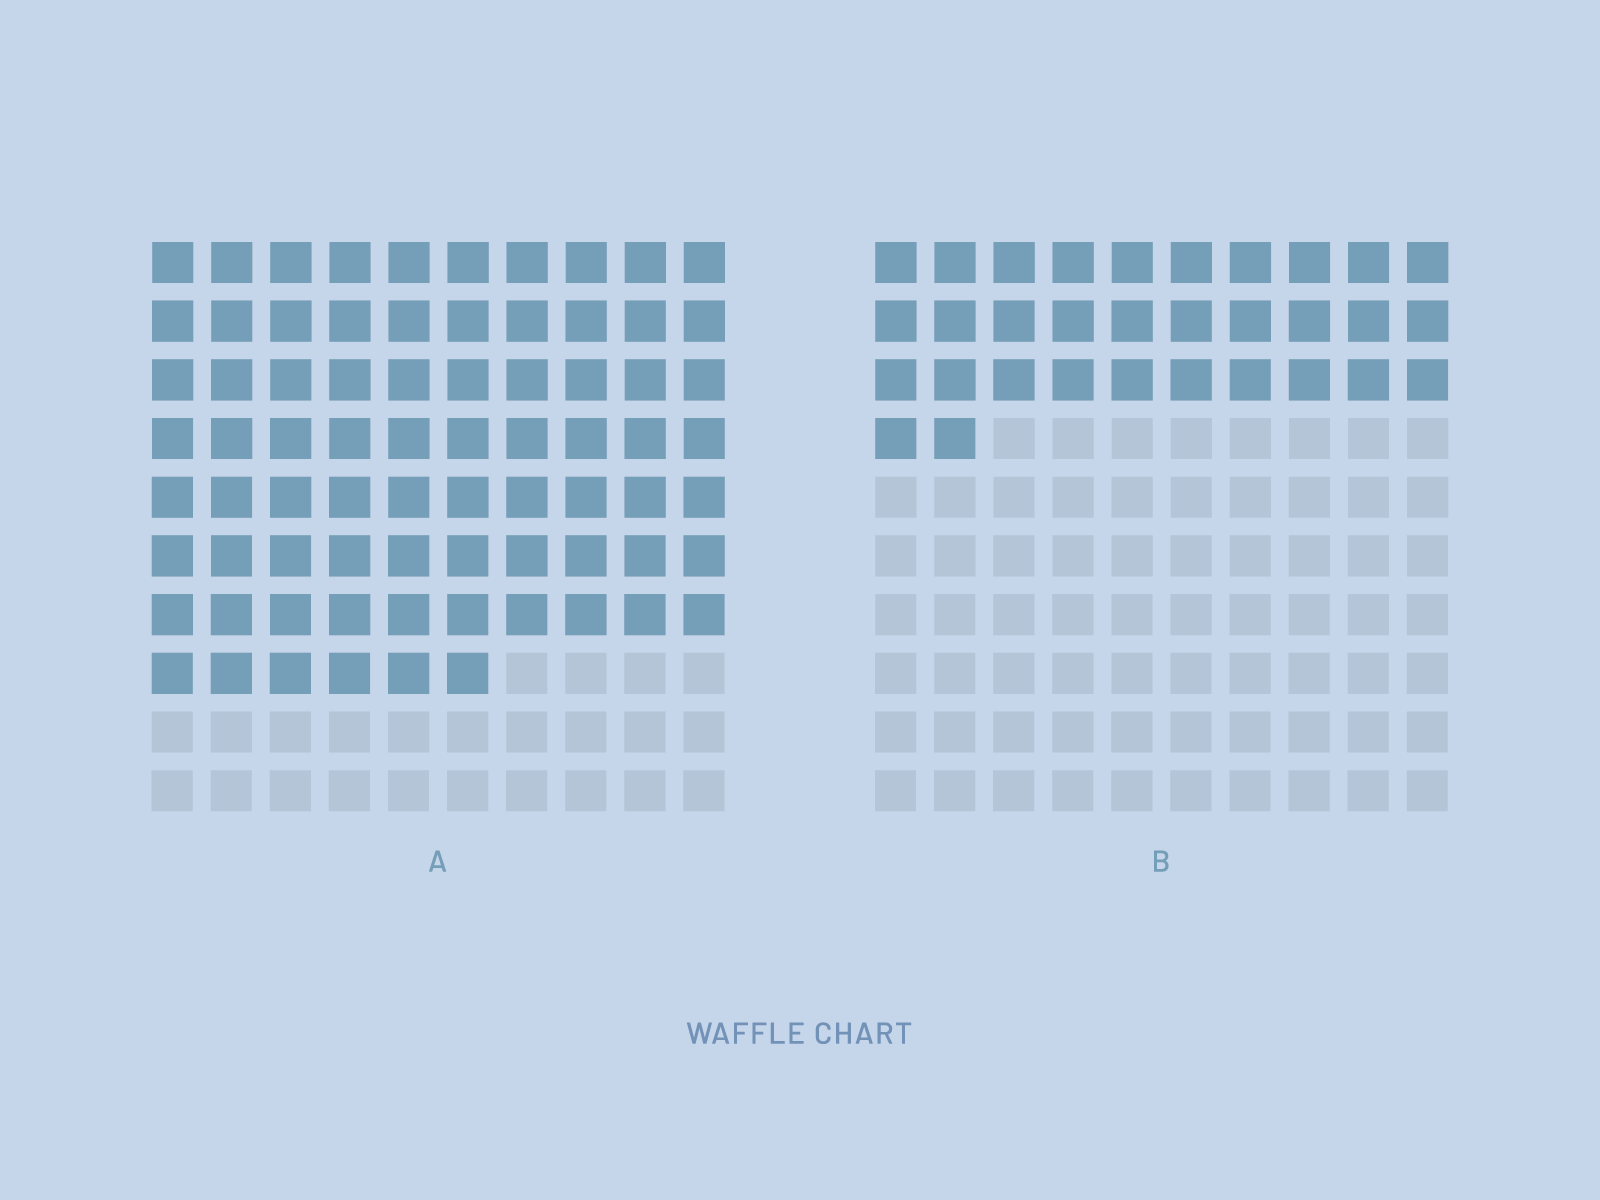
Animated Waffle Chart | 49 Days of Charts
Follow me on Dribbble | Behance | Website
This is part of a little challenge where I create 1 animated chart per day, based on the 49 common chart types documented in Data Visualisation: A Handbook for Data Driven Design Book by Andy Kirk.