Server Dashboard
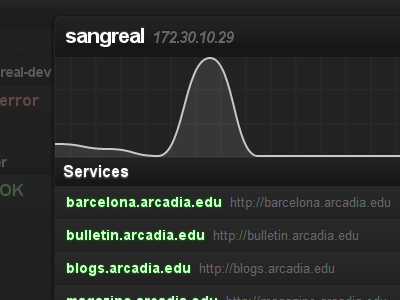
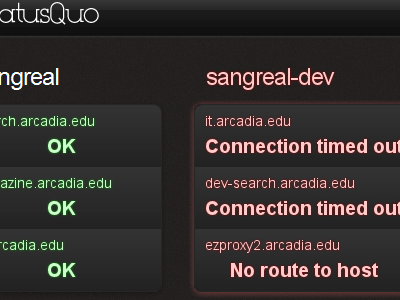
A quick glimpse of a detail view in an application I'm working on. This is all live code and not a single image has been used! It's all CSS3 and canvas. The graph shows the response time of a ping to the specific server. The ping information is given to the browser of a web socket connection and then drawn to a canvas element using Smoothie Charts (http://smoothiecharts.org/)
More by Matt McManus View profile
Like

