Key Metrics Report - Tier 2
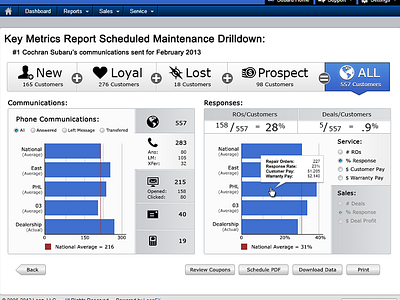
This is a recent report drilldown that includes a large number of data points (100+). Rather than lazily using an enormous grid, I went with a fairly complex series of filters (about 15 separate filters in all) in order to make the data digestible. The bar charts allow for easy comparison between the reported regions with tooltips showing detailed content.
The large amount of information and silly number of buttons wasn't something the stakeholders could compromise on at the time, but I think it turned out pretty well.