-
18614.1k
-
314.2k
-
372.5k
-
51k
-
023
-
038
-
122
-
035
-
044
-
014
-
019
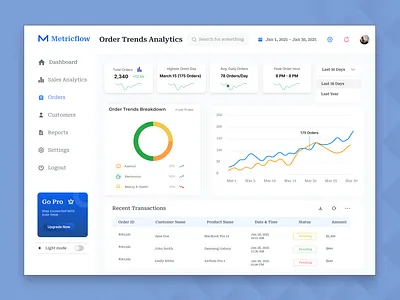
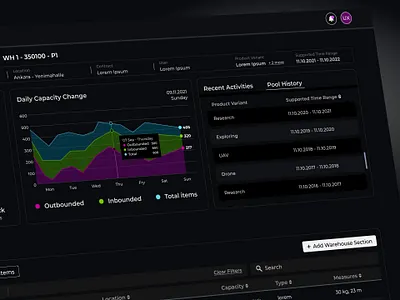
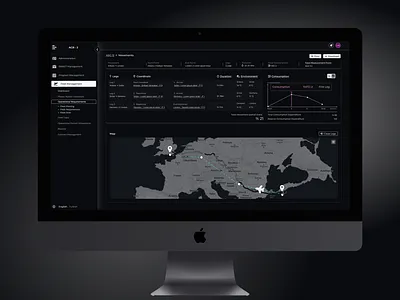
Inspirational chart designs, illustrations, and graphic elements