Dribbble: the community for graphic design
Shots
Shots
Designers
Services
Explore
Popular
New and Noteworthy
Product Design
Web Design
Animation
Branding
Illustration
Mobile
Typography
Print
Hire a Designer
Browse Freelancers
Purchase Services
Submit a Project Brief
Post a Full-Time Job
Find Jobs
Blog
Sign up
Log in
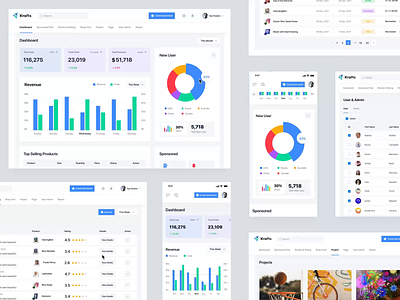
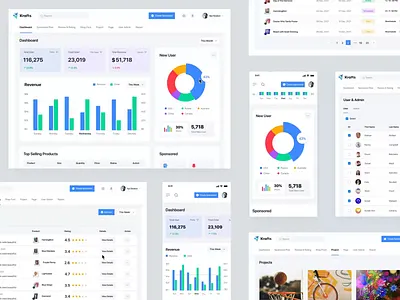
data visualisation
Inspirational data visualisation designs
Popular
Popular
New & Noteworthy
Discover
Animation
Branding
Illustration
Mobile
Print
Product Design
Typography
Web Design
Filters
Clear
Tags
Clear
Color
#faddd1
#fad3d1
#fad1e6
#e5d1fa
#d4d1fa
#d1e3fa
#d1f3fa
#d1faf0
#d1fad7
#ebfad1
#faf9d1
#faefd1
#fae6d1
#f2e2d9
#ffffff
#f4b69c
#f4a09c
#f49cc8
#c69cf4
#a39cf4
#9cc2f4
#9ce5f4
#9cf4df
#9cf4a7
#d4f49c
#f4f19c
#f4dc9c
#f4c89c
#e3c0ac
#e4e4e4
#ee8f66
#ee6d66
#ee66aa
#a866ee
#7166ee
#66a1ee
#66d7ee
#66eece
#66ee78
#bcee66
#eee966
#eeca66
#eeaa66
#d59f80
#b4b4b4
#e86830
#e83a30
#e8308c
#8930e8
#4030e8
#3080e8
#30c9e8
#30e8bd
#30e849
#a5e830
#e8e230
#e8b730
#e88c30
#c67d53
#848484
#c74b16
#c71f16
#c7166f
#6c16c7
#2516c7
#1663c7
#16a9c7
#16c79e
#16c72e
#86c716
#c7c116
#c79816
#c76f16
#a66037
#545454
#913710
#911710
#911051
#4f1091
#1b1091
#104891
#107c91
#109173
#109121
#629110
#918d10
#916f10
#915110
#794628
#242424
#5c230a
#5c0e0a
#5c0a33
#320a5c
#110a5c
#0a2e5c
#0a4e5c
#0a5c49
#0a5c15
#3e5c0a
#5c590a
#5c460a
#5c330a
#4d2c19
#000000
Clear
Timeframe
Select a Timeframe
Select a Timeframe
This Past Week
This Past Month
This Past Year
All Time
Now
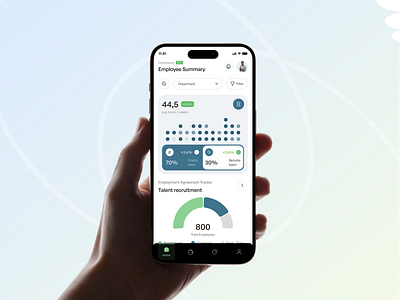
View Alignly - HR Management App
Alignly - HR Management App
Like
Koushik Sarkar
Like
95
3.7k
Shot Link
View Custom modular video
Custom modular video
Like
Algo
Pro
Like
11
9.8k
Shot Link
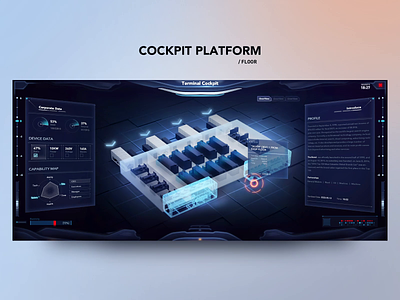
View Cockpit Platform x FUI
Cockpit Platform x FUI
Like
ZAN
Like
203
52.8k
Shot Link
View Generating diversity
Generating diversity
Like
ILLO
Team
Like
947
157k
View HR Management Dashboard Design
HR Management Dashboard Design
Like
Razu Sardar Masud
Like
5
2.1k
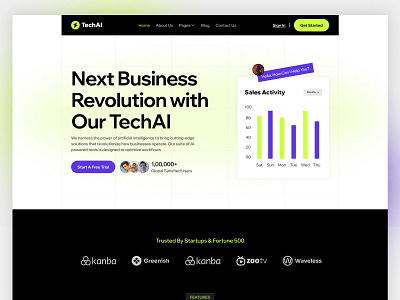
View TechAI - SaaS & Technology Webflow Website Design
TechAI - SaaS & Technology Webflow Website Design
Like
Omor Rahman
Like
15
1.1k
Shot Link
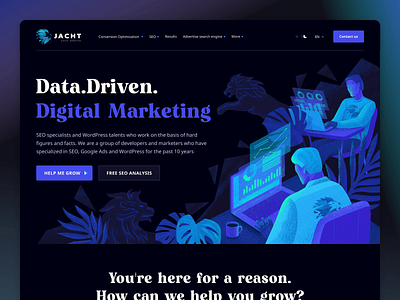
View Home Page for Jacht.Digital
Home Page for Jacht.Digital
Like
The Department
Team
Like
63
18.6k
Shot Link
View Dynamic social videos
Dynamic social videos
Like
ILLO
Team
Like
146
44.2k
Shot Link
View Pie chart animation
Pie chart animation
Like
Algo
Pro
Like
76
34.6k
Shot Link
View Spotify Fan Study: Mobile insights view
Spotify Fan Study: Mobile insights view
Like
RALLY
Team
Like
188
83.9k
View DATA PACKAGING - 3D animation
DATA PACKAGING - 3D animation
Like
lukiano.dsgn
Like
0
153
Shot Link
View Animated Treemap | 49 Days of Charts
Animated Treemap | 49 Days of Charts
Like
Jene Tan
Like
6
3.4k
Shot Link
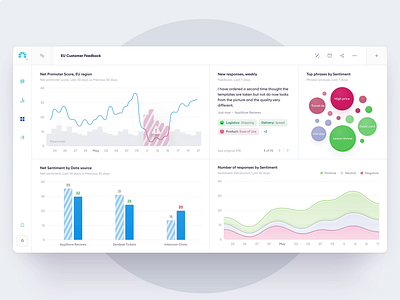
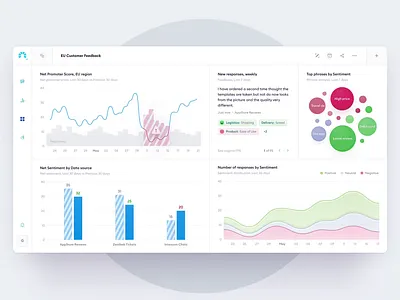
View Chattermill - Dashboard in Motion
Chattermill - Dashboard in Motion
Like
Gregory Muryn-Mukha
Pro
Like
857
454k
Shot Link
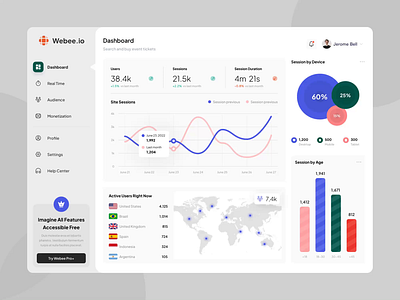
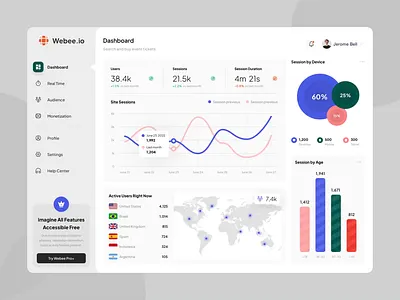
View Webee.io - Website Analytics Dashboard
Webee.io - Website Analytics Dashboard
Like
Vektora
Team
Like
312
71.4k
Shot Link
View Animated Slope Graph | 49 Days of Charts
Animated Slope Graph | 49 Days of Charts
Like
Jene Tan
Like
3
1.8k
Shot Link
View Resizable text
Resizable text
Like
Algo
Pro
Like
235
50k
Shot Link
View Flexible format
Flexible format
Like
ILLO
Team
Like
780
150k
Shot Link
View Data–driven design
Data–driven design
Like
Algo
Pro
Like
49
18.5k
Shot Link
View DotKrafts - Web Application.
DotKrafts - Web Application.
Like
Nasir Uddin
Pro
Like
27
7k
Shot Link
View Automated music videos
Automated music videos
Like
ILLO
Team
Like
276
103k
Shot Link
View Generating diversity
Generating diversity
Like
Algo
Pro
Like
59
13.2k
1
Shot Link
View Tennis data 🎾
Tennis data 🎾
Like
ILLO
Team
Like
148
29k
Shot Link
View ✺ Scale Year-in-Review videos to 500K users ✺
✺ Scale Year-in-Review videos to 500K users ✺
Like
Algo
Pro
Like
79
34.8k
Shot Link
View Invocable - App UI Transitions
Invocable - App UI Transitions
Like
Gregory Muryn-Mukha
Pro
Like
639
151k
← Prev
Next →
Sign up to continue
Loading more…
Previous
Next
Loading…