Dribbble: the community for graphic design
Shots
Shots
Designers
Services
Explore
Popular
New and Noteworthy
Product Design
Web Design
Animation
Branding
Illustration
Mobile
Typography
Print
Hire a Designer
Browse Freelancers
Purchase Services
Talk to Talent Expert
Post a Full-Time Job
Find Jobs
Blog
Sign up
Log in
Abnormal - data
Facebook icon
Share
Twitter icon
Tweet
Copy
9 Shots
•
9 Designers
Nicole Jiang
Facebook icon
Share
Twitter icon
Tweet
Copy
Shot Link
View New Tactics - View Transitions
New Tactics - View Transitions
Like
RALLY
Team
Like
1.5k
170k
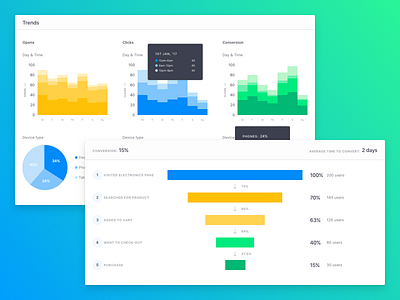
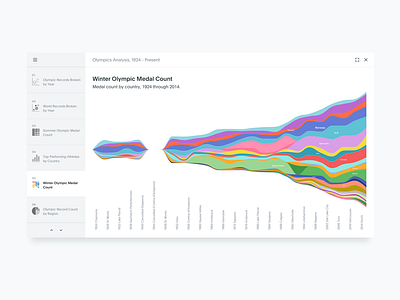
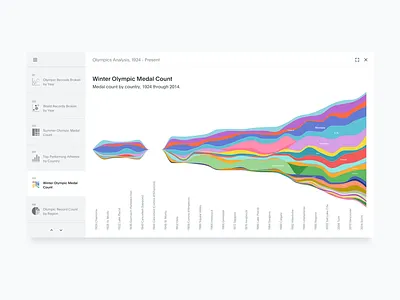
View Charts and Funnels
Charts and Funnels
Like
Tejas Bhatt
Like
56
14.1k
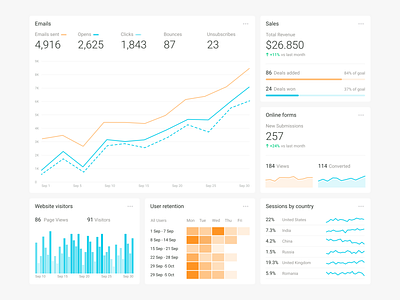
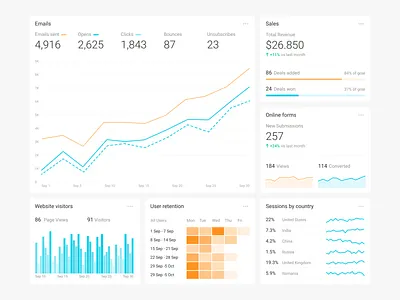
View Dashboard
Dashboard
Like
Claudiu Cioba
Like
106
11.1k
Shot Link
View Experimentation Analysis: Time Series
Experimentation Analysis: Time Series
Like
Uber
Team
Like
249
54.4k
View Presenting Charts in ThoughtSpot
Presenting Charts in ThoughtSpot
Like
ThoughtSpot
Team
Like
71
4k
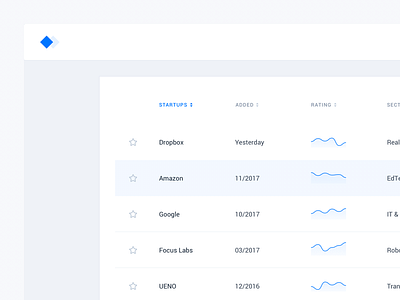
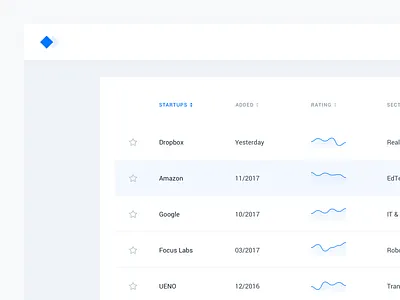
View Data table (sneak peek)
Data table (sneak peek)
Like
Vincent Tantardini
Like
270
50.1k
2
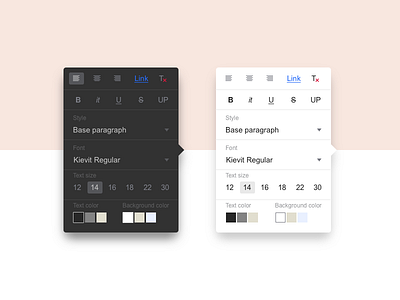
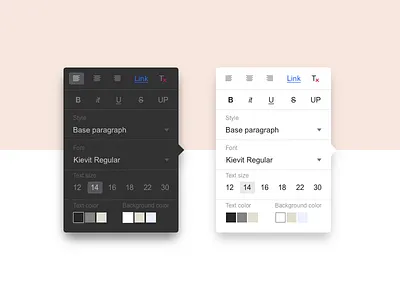
View Rich Text Popup
Rich Text Popup
Like
Anton Borzenkov
Like
520
40.2k
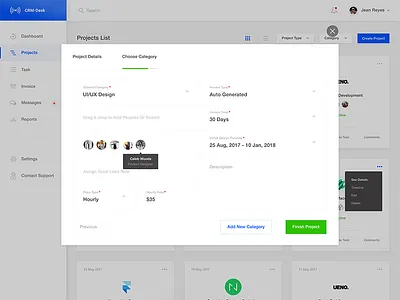
View Project - Choose Category
Project - Choose Category
Like
Mandeep Kundu
Like
543
162k
View Dashboard Elements
Dashboard Elements
Like
Opendoor Design
Team
Like
104
17.9k
Sign up to continue
Loading more…
Previous
Next
Loading…