Dribbble: the community for graphic design
Shots
Shots
Designers
Services
Explore
Popular
New and Noteworthy
Product Design
Web Design
Animation
Branding
Illustration
Mobile
Typography
Print
Find Talent
Browse Profiles
Purchase Services
Talk to Talent Expert
Post a Full-Time Job
Get Hired
Upgrade to
Pro
Advertise
Full-Time Jobs
Blog
Sign up
Log in
Charts
Facebook icon
Share
Twitter icon
Tweet
Copy
12 Shots
•
11 Designers
Martin Fabricius
Facebook icon
Share
Twitter icon
Tweet
Copy
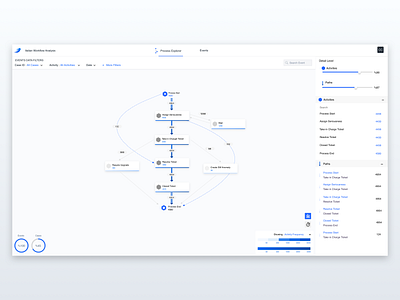
View Process Explorer
Process Explorer
Like
cagatay celebioglu
Like
98
18.4k
1
Shot Link
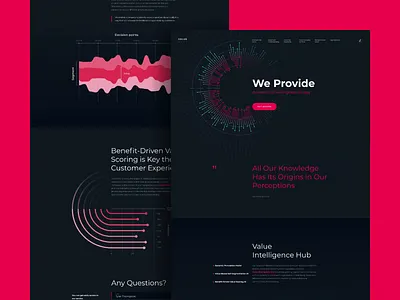
View AI-Based Marketing Website Design
AI-Based Marketing Website Design
Like
tubik
Team
Like
645
119k
View Dashboard
Dashboard
Like
uixNinja
Pro
Like
602
67.7k
Shot Link
View Deals
Deals
Like
DailyDeal
Team
Like
864
106k
Shot Link
View Period Over Period Mobile Concept Animation
Period Over Period Mobile Concept Animation
Like
Gavin
Like
8
2.6k
1
Shot Link
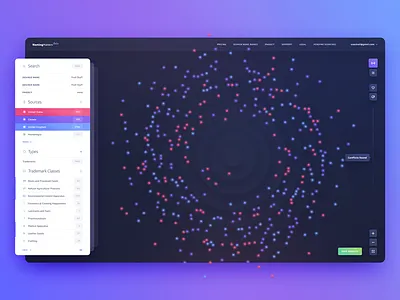
View Dynamic Context Bubble Visualization
Dynamic Context Bubble Visualization
Like
Gavin
Like
115
11.2k
View Sales Funnel
Sales Funnel
Like
Salesforce Design
Team
Like
1k
109k
View Oferta da Boa / Admin panel
Oferta da Boa / Admin panel
Like
Алексей Юрков
Like
288
25.3k
Shot Link
View New Tactics - View Transitions
New Tactics - View Transitions
Like
RALLY
Team
Like
1.5k
170k
View Bureau Oberhaeuser Calendar 2018
Bureau Oberhaeuser Calendar 2018
Like
Bureau Oberhaeuser
Pro
Like
273
32.4k
Shot Link
View Dataface - Animation map persons
Dataface - Animation map persons
Like
ADN Agency
Like
7
2.7k
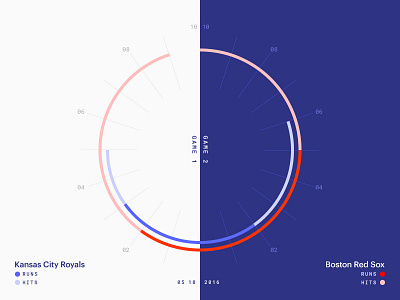
View Red Sox Scores: May 18, 2016
Red Sox Scores: May 18, 2016
Like
Fore Design
Team
Like
524
28.5k
Sign up to continue
Loading more…
Previous
Next
Loading…