✨ InstantMatch: Get matched with top design talent instantly
Get Matched Now
Dribbble: the community for graphic design
Shots
Shots
Designers
Services
Explore
Popular
New and Noteworthy
Product Design
Web Design
Animation
Branding
Illustration
Mobile
Typography
Print
Find Talent
Get Matched Now
New
Browse Profiles
Purchase Services
Hire Fractional Talent
Post a Full-Time Job
Get Hired
Upgrade to
Pro
Advertise
Full-Time Jobs
Blog
Sign up
Log in
MAP TRAFFIC
Facebook icon
Share
Twitter icon
Tweet
Copy
3 Shots
•
3 Designers
Nguyen Van Lanh
Facebook icon
Share
Twitter icon
Tweet
Copy
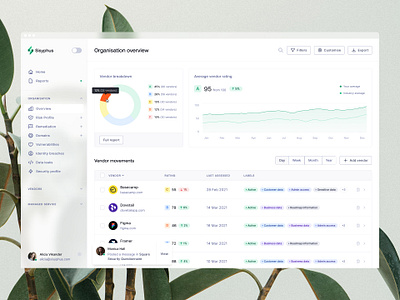
View Sisyphus™ — dashboard charts (light mode)
Sisyphus™ — dashboard charts (light mode)
Like
Jordan Hughes®
Pro
Like
591
440k
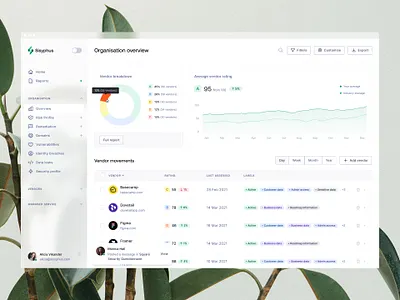
View Data Grid
Data Grid
Like
Innovatemap
Team
Like
340
295k
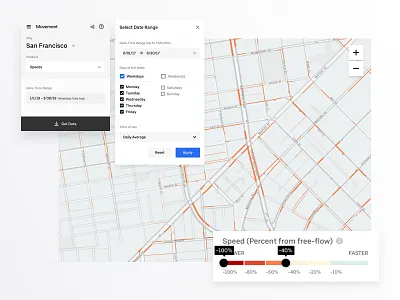
View Detecting Speed with Data Design
Detecting Speed with Data Design
Like
Uber
Team
Like
385
126k
Sign up to continue
Loading more…
Previous
Next
Loading…