
-
19065.1k
-
384180k
-
18156.7k
-
9176.1k
-
251153k
-
231.6k
-
162106k
-
112.5k
-
3412.2k
-
996134k
-
1.3k343k
-
35684.9k
-
20024.7k
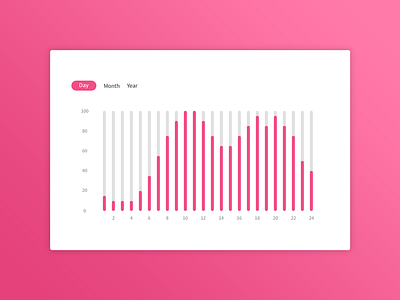
![Graph Widget [UI with Generista] bars clean data fitness generista graph interface ios minimalism modal progress snippet tracking typography ui uidesign ux visualization weight widget](https://cdn.dribbble.com/userupload/17121412/file/original-33720d1191dc3f843e95808cb8214001.png?resize=400x0)
![Graph Widget [UI with Generista] bars clean data fitness generista graph interface ios minimalism modal progress snippet tracking typography ui uidesign ux visualization weight widget](https://cdn.dribbble.com/userupload/17121412/file/original-33720d1191dc3f843e95808cb8214001.png?format=webp&resize=400x300&vertical=center)


Loading more…


