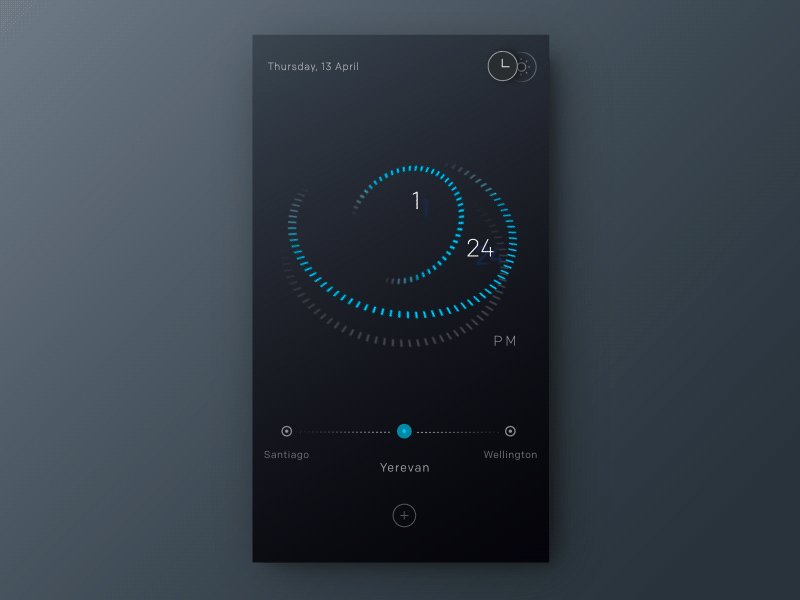
1. orbit clock - animated version clean clock minimal orbit time ui watch
    View orbit clock - animated version
    orbit clock - animated version
    99
    14.5k
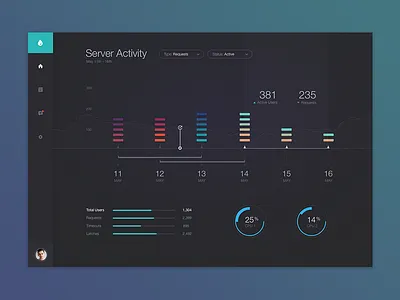
  2. Server Dashboard branding dashboard data graph grid ios layout mockup palette product typography ui ui kit
    1
    View Server Dashboard
    Server Dashboard
    2.9k
    306k
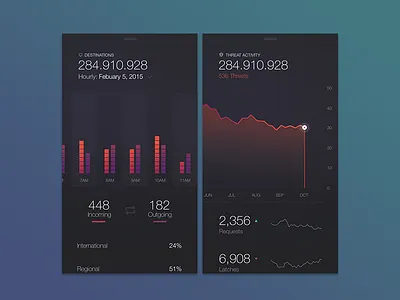
  3. Server iOS Screens chart data graph grid ios layout mockup ui
    1
    View Server iOS Screens
    Server iOS Screens
    1.1k
    77.4k
  4. Foundry: Columns View blender cards dataset din grid histogram small multiples ui visualization
    1
    View Foundry: Columns View
    Foundry: Columns View
    238
    26.8k
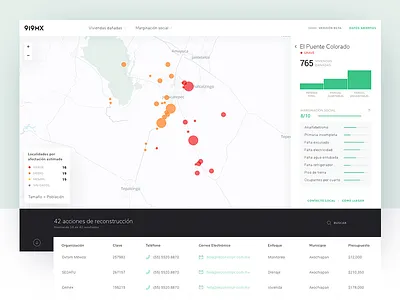
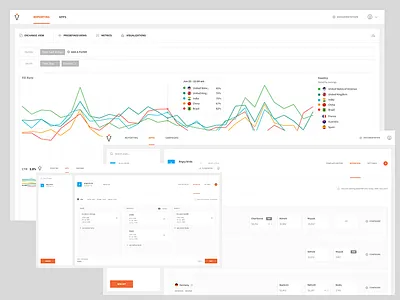
  5. Brigada Map data graph map mexico platform product table ui ux
    View Brigada Map
    Brigada Map
    228
    32.8k
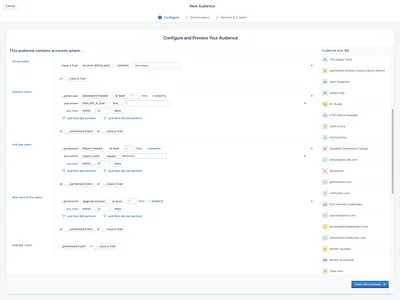
  6. Personas for Accounts! account audiencing account based accounts audiencing b2b b2b design business personas side sheet
    View Personas for Accounts!
    Personas for Accounts!
    54
    14.8k
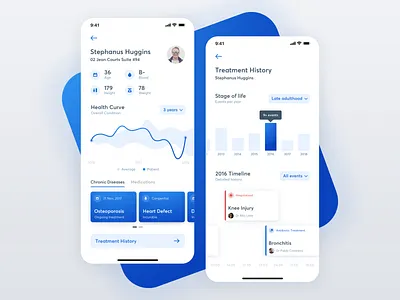
  7. MediQR — Profile & History blue clean curve disease drug graph health history medical medicine profile timeline treatment ui
    View MediQR — Profile & History
    MediQR — Profile & History
    1.5k
    247k
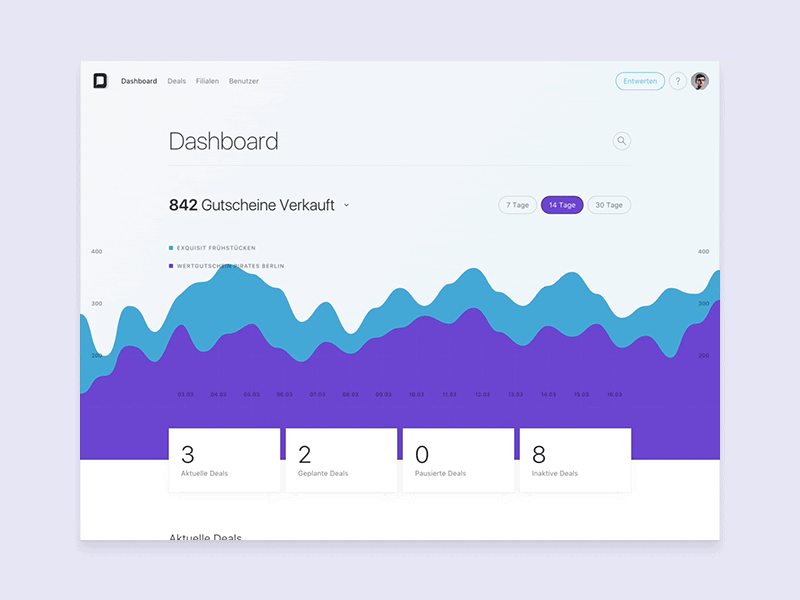
  8. Dashboard Loading Animation animation clean dashboard data data visualisation e commerce line chart minimal web web app web site
    View Dashboard Loading Animation
    Dashboard Loading Animation
    358
    45.1k
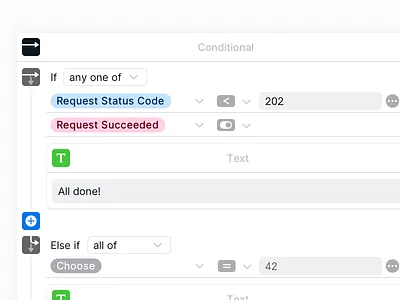
  9. Conditional Block
    View Conditional Block
    Conditional Block
    93
    10.3k
  10. Scaling Machine Learning at Uber with Michelangelo analysis app complex dashboard data data visualization datavis industry machine learning performance scaling uber uber design web
    View Scaling Machine Learning at Uber with Michelangelo
    Scaling Machine Learning at Uber with Michelangelo
    450
    105k
  11. Avocarrot Dashboard Release Peek #2 app avocarrot dashboard data graph navigation product design report table user interface web design
    View Avocarrot Dashboard Release Peek #2
    Avocarrot Dashboard Release Peek #2
    36
    5.3k
  12. Restaurant Chronicle: Uber Eats Debugging Tool analysis data visualization debugging insights uber uber design web tool
    View Restaurant Chronicle: Uber Eats Debugging Tool
    Restaurant Chronicle: Uber Eats Debugging Tool
    278
    49.7k
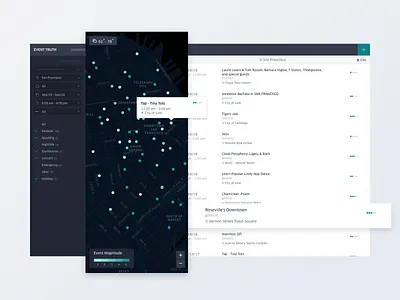
  13. Event Truth context data visualization event truth events explore marketplace platform tools uber uber design
    View Event Truth
    Event Truth
    345
    55.6k
  14. Uber Movement for New Mobility charts data data design graph maps tools uber uber design ui design
    View Uber Movement for New Mobility
    Uber Movement for New Mobility
    563
    79k
  15. Azure Monitor Map application azure enterprise health insights map monitor service web
    View Azure Monitor Map
    Azure Monitor Map
    230
    55.6k
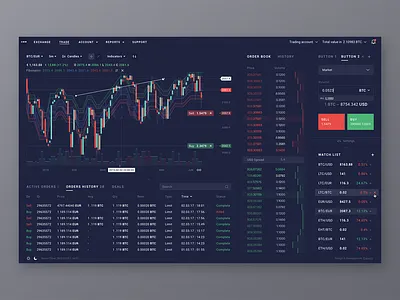
  16. Trading Terminal book charts cuberto graphics history order platform search terminal trade trading ui ux
    View Trading Terminal
    Trading Terminal
    656
    122k
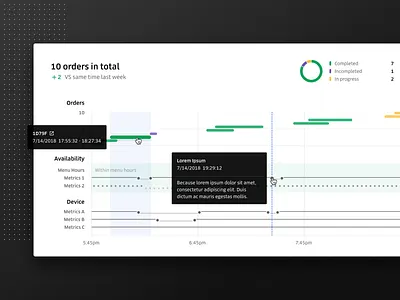
  17. Trust: Data Quality Alerting System analysis complex dashboard data data visualization datavis health monitor quality uber uber design web
    View Trust: Data Quality Alerting System
    Trust: Data Quality Alerting System
    500
    81.1k
  18. Data Visualization Concept—UI Weekly Challenges S02 [5/10] blue concept dark data graph interface purple run track ui ux visualisation
    9+
    View Data Visualization Concept—UI Weekly Challenges S02 [5/10]
    Data Visualization Concept—UI Weekly Challenges S02 [5/10]
    476
    44.1k
  19. City Statistics Data Visualization city data visualization graph information design interface statistic stats ui user experience user interface ux
    View City Statistics Data Visualization
    City Statistics Data Visualization
    604
    54.5k
Loading more…