Dribbble: the community for graphic design
Shots
Shots
Designers
Services
Explore
Popular
New and Noteworthy
Product Design
Web Design
Animation
Branding
Illustration
Mobile
Typography
Print
Find Talent
Get Matched Now
New
Browse Profiles
Purchase Services
Hire Fractional Talent
Post a Full-Time Job
Get Hired
Upgrade to
Pro
Advertise
Full-Time Jobs
Blog
Sign up
Log in
data
Facebook icon
Share
Twitter icon
Tweet
Copy
5 Shots
•
4 Designers
Biarritz
Facebook icon
Share
Twitter icon
Tweet
Copy
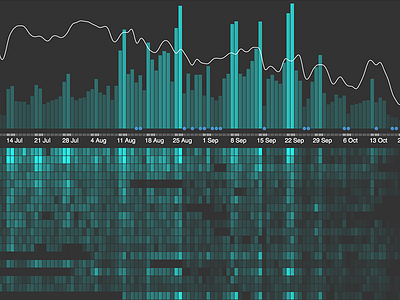
View Bike share interactive stats
Bike share interactive stats
Like
Urbica Design
Like
48
9.6k
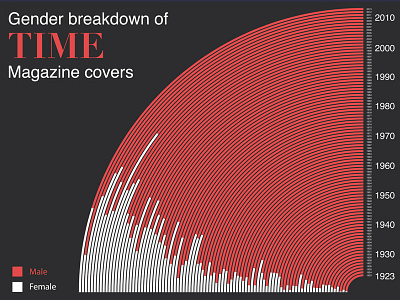
View Gender Breakdown of Time Magazine Cover - Data visualisation
Gender Breakdown of Time Magazine Cover - Data visualisation
Like
Carina P
Like
67
11.8k
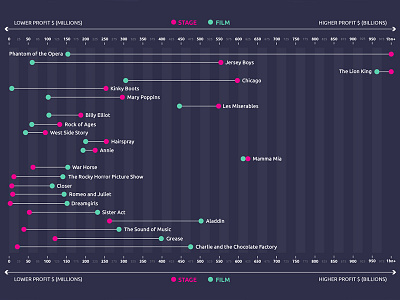
View Stage vs Screen
Stage vs Screen
Like
Carina P
Like
19
3.3k
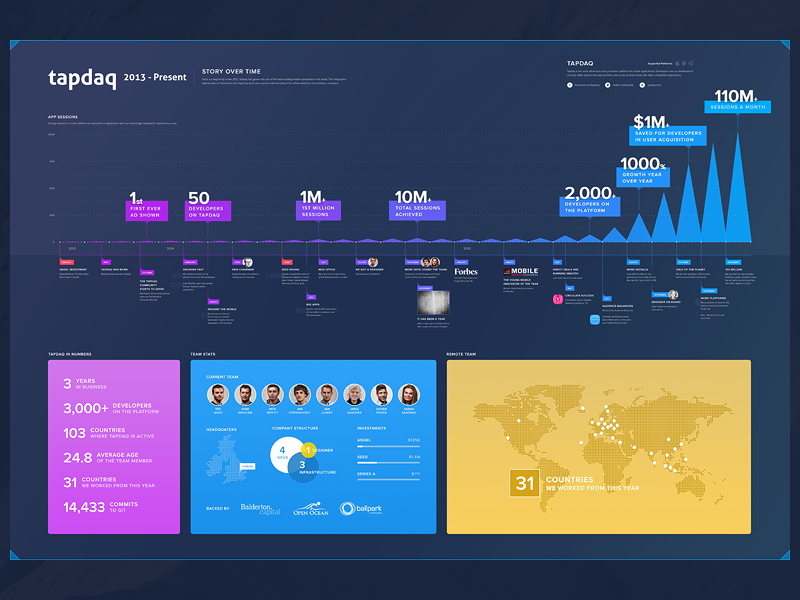
View Tapdaq Story Infographic
Tapdaq Story Infographic
Like
Jan Losert
Pro
Like
621
79.4k
Shot Link
View Data Self Portrait - Dashboard
Data Self Portrait - Dashboard
Like
Lucas Berghoef
Like
89
6.7k
Sign up to continue
Loading more…
Previous
Next
Loading…